^ That's why I used the terms "may" and "typically" in my response. Maybe "typically" was too strong, as that's based on my particular FIREcalc data inputs.
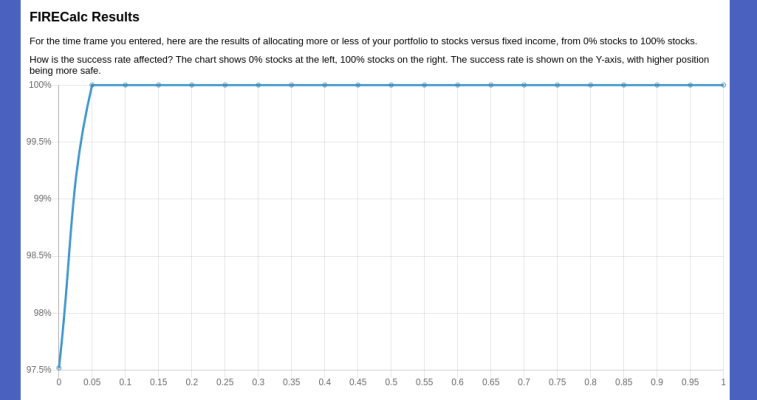
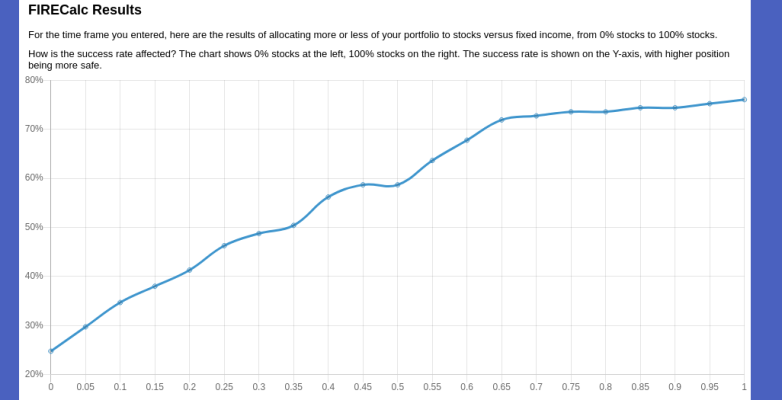
If you look at 40 year periods, use a spending level that is about 95% safe, and include a solid amount of SS (which are my particular inputs), then you will find that there is a middle plateau with some tailing off at the right side of the graph. I suspect the effect would be even more pronounced with shorter time durations (like 10 years or 20 years), as in those scenarios there are timeframes where higher stock AAs fail due to steep dropoffs early in the period (like 1987, 2000, 2008).
But you've illustrated the larger point, which is that people should (a) look at their own situations in FIREcalc or their preferred tools, and (b) not take other people's or other tool's word for stuff.
If you are saying that the AA success curve will vary with how many years you are looking at sure, and as you say, short time frames will be bad for high stock AA - not enough time to recover from a dip.
But "may" and "typically" strike me as rather odd to describe historical data - it returns values, the same values every time.
I also think you are confusing things by bringing SS into the discussion of AA vs portfolio success. Since SS is modeled as inflation adjusted, it is just a straight reduction n the withdraw rate of the portfolio. As an example, the AA/success curve should look exactly the same for someone who start with a $1M portfolio and $20,000 spend (2% WR), and someone who has a $40,000 spend and $20,000 SS. The AA curve doesn't change due to SS, it changes because SS brought the WR back down to 2%.
Sure, with SS your income never drops to zero (assuming SS doesn't fail), but if we define "failure" the same (your portfolio going to zero), the curves are all the same.
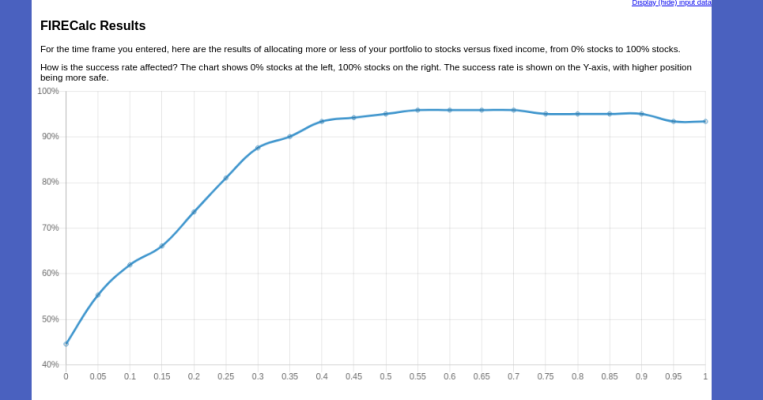
OK, most of the above can be seen as just quibbling over semantics. I only go there because I think it's important we are all talking the same language. The important take away that we both see, is that portfolio success is not very sensitive to AA above ~ 40/60. It's one of those things that has helped me to be more like Alfred E. Neuman ("What, me worry?"). I love the fact that most of this financial analysis says you can be loose and lazy - just stay with low cost broad indexes, maybe rebalance, maybe not, and you are probably as good or better than someone who tinkers with it.
I've only actively rebalanced a couple times in over 15 years. Even once I'm taking SS/pension, I can probably rebalance as part of selling for RMDs, and rarely ever actively rebalance (by "active", I mean do it outside of just selling to meet expenses).
-ERD50