audreyh1
Give me a museum and I'll fill it. (Picasso) Give me a forum ...
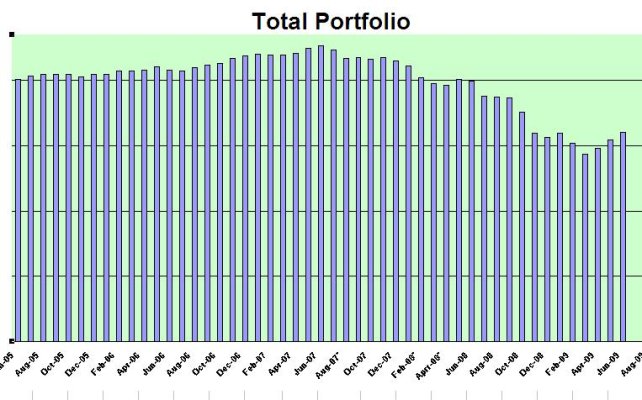
My retirement fund all time high was also in Oct 2007, although I came very, very close to it again in May 2008. In early March 2009 the portfolio was down 40% from that all time high.
As of now it is down only 25% from that all time high.
Even though I am nowhere near that peak (which at the end of 2007 was 62% above what I retired with in 1999), I'm feeling pretty cheery about the recovery so far!
Probably because now at least the portfolio is also 25% ahead of when I retired in 1999,D feeling green!) whereas in early March 2009 it was slightly under the initial (1999) portfolio value!
Audrey
As of now it is down only 25% from that all time high.
Even though I am nowhere near that peak (which at the end of 2007 was 62% above what I retired with in 1999), I'm feeling pretty cheery about the recovery so far!
Probably because now at least the portfolio is also 25% ahead of when I retired in 1999,
D feeling green!) whereas in early March 2009 it was slightly under the initial (1999) portfolio value! Audrey