Bear Mkt has begun.My FIRE plans solidified.

This is pretty much the standard advice here, and it has the advantage of being conventional and there relatively immune to criticism.

However, experience with markets suggests that there are better and worse times to have more or less money in US stocks. These times can never be absolutely known, but IMO using educated guesses about times to go heavy, and times to be light tends to improve results.

This is for large groups, not individual stocks.

Ha

According to all of the academics that follow information about market timing, no one knows how to do it, they don't even know anyone that knows anyone that can do it.

It usually leads to reduced results IMO.
 
OP.....Never mind about the bear market.


Could you look into your crystal ball and tell me if the Rams will cover the spread versus the "Bears" this Sunday?


Right now that is the only "bear" I care about!


I can't bear to talk about this anymore.:D


Gonna be a good one. NFL put a nicely matched schedule together for a lot of teams.
 
+1


1. Set your date

2. Select an allocation that you are comfortable with

3. Have 3 to 5 years of cash on the side to cover your fixed expenses.


Or as Ron Popeill used to say, "set it and forget it."


I


Great advice! This is what we’ve done and despite running many scenarios pre-ER, we’ve been remarkably calm since ER. We know we have enough and we just stick with our plan. For me, having 2-3 years of cash set aside is enough. YMMV
 
I’m in this OMY or TMY mode right now, but I’m also banking on a 3.5 SWR, and SORR is a concern if i want to maintain a nice/current life in my high COL area of Seattle. I’m only 51. When I punch out I want to do it for good and not have to go back and be a Walmart greeter. Plus, I love living in the great PNW. But, everday is precious; “The future is uncertain and the end is always near.” A handful of close friends have died or are battling cancer.


Most of high cost part of living in a high cost of living area is often housing. So if you have a mortgage free home or have housing covered in some other way it may not cost much more to retire where you are at than other locations. In some ways it can be cheaper. We have relatives who live in a more rural area than us and except for housing I think many of their purchases are actually more expensive than ours. They tend to have more more monopoly pricing for local purchases like groceries, Internet service providers and home repairs with only one merchant / service provider in town for each type of expense. Plus they have to spend a lot more in gas than we do for all their errands and doctor appointments because they live further away from shopping, medical and entertainment centers.
 
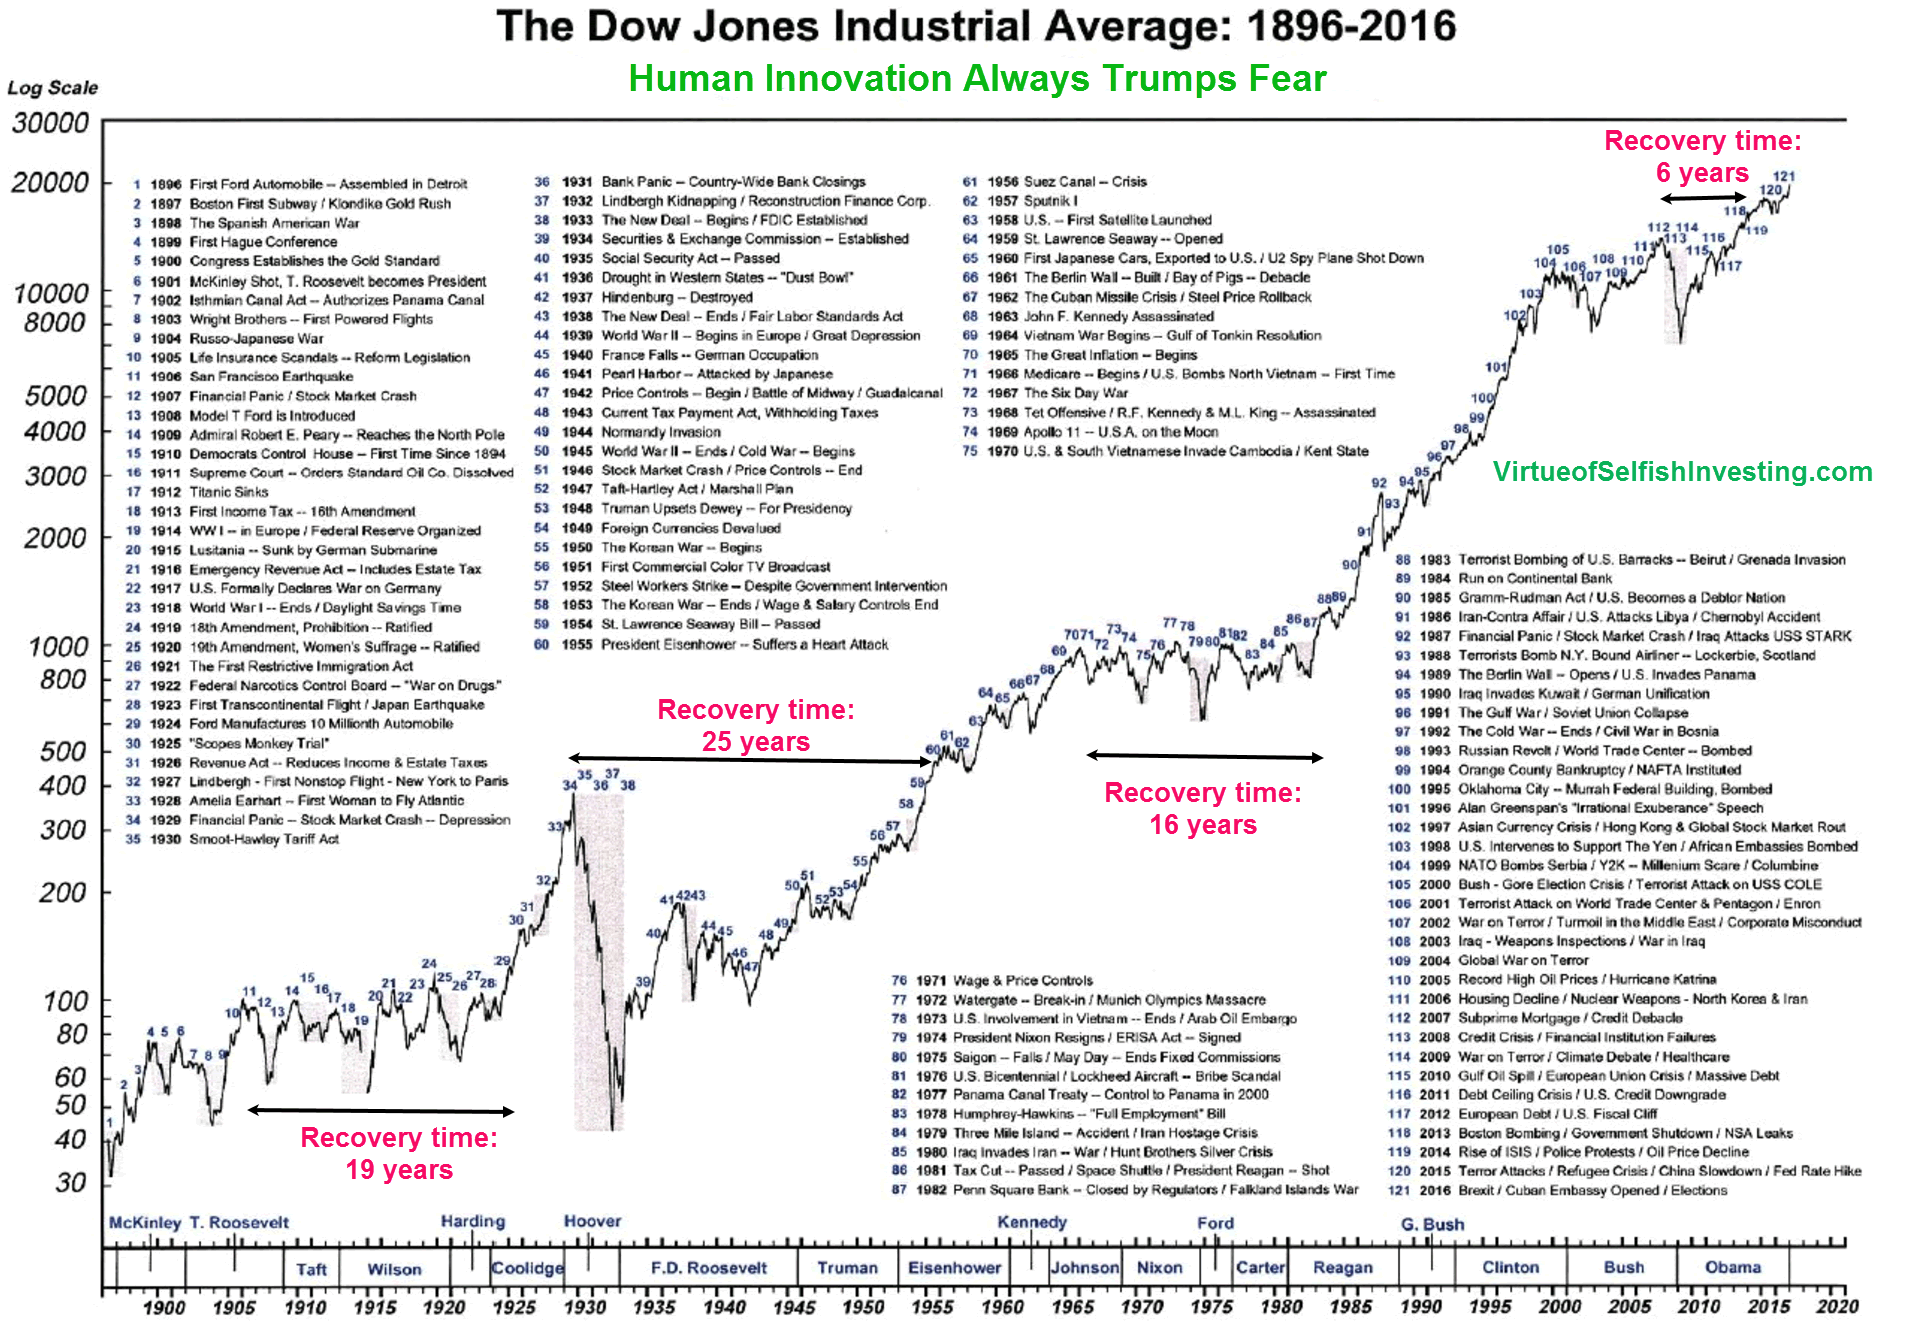
THIS is the chart that concerns me, and should concern everyone in ER or even planning ER anytime soon.

Not sure about any of you, but we don't have 16 years - or 19 or 25 years - to get back to "even" as of 10/1/18. Yes, stocks do well in the long run..but there are periods of decades at time that they truly suck. I don't want to experience that type of scenario in ER.

Even 6 years to get back to "even" would not be good.


MW-FI823_DowCor_20170323160402_NS.png
 
Last edited:
Are they the same economists who predicted the last twelve of our three recessions?

:LOL: Exactly! And what blows me away is that so many people still give them quite a bit of credibility despite this. I think the root of this mistake is the fact that most people find it difficult to impossible to admit to themselves, that anything is actually unknown.
 
Most of high cost part of living in a high cost of living area is often housing. So if you have a mortgage free home or have housing covered in some other way it may not cost much more to retire where you are at than other locations. In some ways it can be cheaper. We have relatives who live in a more rural area than us and except for housing I think many of their purchases are actually more expensive than ours. They tend to have more more monopoly pricing for local purchases like groceries, Internet service providers and home repairs with only one merchant / service provider in town for each type of expense. Plus they have to spend a lot more in gas than we do for all their errands and doctor appointments because they live further away from shopping, medical and entertainment centers.

Usually true with the housing, but for example where we use to live a paid off newer house worth 800k still had taxes of 25k.
 
THIS is the chart that concerns me, and should concern everyone in ER or even planning ER anytime soon.

Not sure about any of you, but we don't have 16 years - or 19 or 25 years - to get back to "even" as of 10/1/18. Yes, stocks do well in the long run..but there are periods of decades at time that they truly suck. I don't want to experience that type of scenario in ER.

Even 6 years to get back to "even" would not be good.


MW-FI823_DowCor_20170323160402_NS.png


That is interesting. I'm not sure I have seen that before but does make a person stop to do some math. LOL
 
THIS is the chart that concerns me, and should concern everyone in ER or even planning ER anytime soon.
...

Or not.

Does that include dividends? Many of those type of charts do not.

https://www.dummies.com/personal-fi...s-trading/dividends-contributions-to-returns/

From January 1926 to December 2008, the S&P 500 Index (and its predecessors) delivered an annualized total return of 9.69 percent per year. The shocking aspect of that is that over those 83 years, price appreciation (rising share prices) accounted for only 5.5 percentage points of that 9.69 percent. Dividends actually accounted for the remaining 4.19. In other words, dividend income comprised 43.27 percent of the S&P’s returns:
And that chart is included in a FIRECalc run. And that reports that a 3.34% initial WR, inflation adjusted survived a 40 year retirement 100% of the time.


... Not sure about any of you, but we don't have 16 years - or 19 or 25 years - to get back to "even" as of 10/1/18. Yes, stocks do well in the long run..but there are periods of decades at time that they truly suck. I don't want to experience that type of scenario in ER.

Even 6 years to get back to "even" would not be good.

Why do you need to "get back to even"? Sure, you want to (and more), but you don't need to. Every year you live means your stash needs to last one year less. You don't need to die with what you started with.

Relax (unless you have a high WR, or don't have at least 35% equities in your AA to provide long term growth).


-ERD50
 
  • Like
Reactions: W2R
Most of high cost part of living in a high cost of living area is often housing. So if you have a mortgage free home ....

How does mortgage/no mortgage fit into this?

Your mortgage is tied to the home value when you took it out, it is fixed. Is this another case where the poster ignores the money that went into paying off the mortgage or paying cash for the house, and is only looking at the mortgage payments? That makes no sense.

-ERD50
 
Last edited:
One thing about if it takes that long to get back to even I won't have to worry about larger RMD when that time comes. LOL
 
The Plan: With the average Bear market lasting approx. 18 mo, then I think the bottom of this Bear will be somewhere around March 2020; S&P 500 at 2344 (-20%). Therefore, I should work for the mega corp man until March 2020 and then FIRE. During now and then I do some major DCA, load up on Dividend ETFs for the after tax account, and reap the benefits of the 401K employer match. I’ll be 53 and DW 57 by then. I can do it even though my heart wants to FIRE now!

A lot of (far-fetched IMHO) assumptions in that plan.

But it's your plan and you can always revise it as needed.

Good luck with all that.
 
what blows me away is that so many people still give them quite a bit of credibility despite this. I think the root of this mistake is the fact that most people find it difficult to impossible to admit to themselves, that anything is actually unknown.

Better to get it right from the horse's mouth:

The only function of economic forecasting is to make astrology look respectable.

-- John Kenneth Galbraith
 
  • Like
Reactions: W2R
How does mortgage/no mortgage fit into this?

Your mortgage is tied to the home value when you took it out, it is fixed. Is this another case where the poster ignores the money that went into paying off the mortgage or paying cash for the house, and is only looking at the mortgage payments? That makes no sense.

-ERD50


You left off part of my post that said have housing covered in some other way. I have a low interest, fixed rate mortgage offset with non-COLA pension income and higher return investment income.
 
THIS is the chart that concerns me, and should concern everyone in ER or even planning ER anytime soon.

Or not.

Does that include dividends? Many of those type of charts do not.

https://www.dummies.com/personal-fi...s-trading/dividends-contributions-to-returns/

And that chart is included in a FIRECalc run. And that reports that a 3.34% initial WR, inflation adjusted survived a 40 year retirement 100% of the time.

-ERD50

OK, I checked, and NO.

Your chart says it took 6 years to recover the 2007 drop. But...

https://stockcharts.com/freecharts/perf.php?$DJITR

set the slider to go from 09OCT2007 (looked like the peak to me), and 02MAY2011 to find when it recovered its previous value.

Hmmm, 3 years and 7 months? That's not 6 years! Is your 6 years some kind of 'dog years' or something?

Actually, 6 human calendar years later, 09OCT2013, the DJIA value was UP 23.48%.

That 'fake news' stuff is everywhere! Check your source data, always!

-ERD50
 
You left off part of my post that said have housing covered in some other way. I have a low interest, fixed rate mortgage offset with non-COLA pension income and higher return investment income.

Yes, because I could not see the relevance to most people of "covered in some other way". What is that supposed to mean - a Sugar Daddy/Mommy or something? Or a 'guest' of the county jail?

Money is fungible. Your mortgage is a cost, your pension is income. If you lived in an area of lower cost housing, would they reduce your pension? Coupling them makes no sense at all. A cost is a cost, income is income.

-ERD50

Live with parents, rent controlled apartment, tiny house on relative's backyard, mortgage free home, etc.? Before we retired we had already retired friends tell us it did not cost much more to live in the Bay Area than retire some place else cheaper because their houses were paid for and their other expenses would not decrease much if they moved. I thought that was an interesting point and one we realized would be true for us, too, though not interesting enough to debate endlessly online on how to word the concept to others. :)

Also see:
High cost of living is really all about housing
https://www.citylab.com/equity/2014/07/cost-of-living-is-really-all-about-housing/373128/
 
This is pretty much the standard advice here, and it has the advantage of being conventional and there relatively immune to criticism.

However, experience with markets suggests that there are better and worse times to have more or less money in US stocks. These times can never be absolutely known, but IMO using educated guesses about times to go heavy, and times to be light tends to improve results.

This is for large groups, not individual stocks.

Ha
So is this one of those time that's is better to have a less money in the stock market. Or is it a great buying opportunity.

I'm in the former camp, but it interested in arguments who think this is just a blip in a bull market.
 
We are at 55/35/10. Reinvesting dividends staying the course. Will not touch portfolio in VG until 2022. I'm done worrying about it. We will live on cash and i bonds outside VG acct. until 2022. If we're down 50% of what our portfolio says today in 2022, with our rate spending we're still good. I firecalc start portfolio at 50% less that what it is today. I used 2% inflation and used consistent growth portfolio of 2% consistent growth. I don't know why that doesn't make sense to me, but that's what it said. 100% good to go
 
For the life of me, I can't fathom why people were falling all over themselves to buy the same stocks at Dow 26.5K that they can't wait to sell at Dow 24.3K.

Take NOW. Yesterday, buyers couldn't get enough of it at 187. Now, they can't dump it fast enough at 180. In the meantime, NOTHING has changed about the company, it's revenue or profit outlook, etc. NOTHING.

THIS IS NOT "INVESTING". Its' gambling. What color of the roulette wheel is your stock going to land on today? Red or black?

That's why I'm 100% convinced this market is broken. We have never seen anything quite like it, and once we're back to Dow 26K (if we ever get there again in my lifetime), I'm selling every last share of stock and funds I own and going 100% cash the rest of my natural life. I want absolutely NOTHING to do with this type of market, because I'm convinced it's not operating in any way like it ever has before - and I no longer want to have anything to do with it.
 
+1

1. Set your date
2. Select an allocation that you are comfortable with
3. Have 3 to 5 years of cash on the side to cover your fixed expenses.

Or as Ron Popeill used to say, "set it and forget it."

I
I am beginning to realize that this is the only way I will ever retire. Sure, I'd like to retire at the top of bull, but then it's downhill from there.
 
For the life of me, I can't fathom why people were falling all over themselves to buy the same stocks at Dow 26.5K that they can't wait to sell at Dow 24.3K.

Take NOW. Yesterday, buyers couldn't get enough of it at 187. Now, they can't dump it fast enough at 180. In the meantime, NOTHING has changed about the company, it's revenue or profit outlook, etc. NOTHING.

THIS IS NOT "INVESTING". Its' gambling. What color of the roulette wheel is your stock going to land on today? Red or black?

That's why I'm 100% convinced this market is broken. We have never seen anything quite like it, and once we're back to Dow 26K (if we ever get there again in my lifetime), I'm selling every last share of stock and funds I own and going 100% cash the rest of my natural life. I want absolutely NOTHING to do with this type of market, because I'm convinced it's not operating in any way like it ever has before - and I no longer want to have anything to do with it.

Since the market can tank some more and you want to get out, why not sell now and go from there?
 
Since the market can tank some more and you want to get out, why not sell now and go from there?

Because I'd lock in a heavy, six figure loss.

I'm going to sit on what will almost certainly be "dead money" until it comes back and live off after-tax cash & CDs. Once it IS back (if ever in my lifetime), I'm a heavy seller at that point.
 
I haven't been following this thread, but just skimmed through it and noticed one problem in post #31:

THIS is the chart that concerns me, and should concern everyone in ER or even planning ER anytime soon. ...
Actually the chart is nearly useless and absolutely should not be relied on to draw any kind of conclusions at all.

First, it includes the excitement of 1929 and the years following, a period in financial history that is so different from the recent past that IMO it is irrelevant. Few of companies that were in the DJI at the beginning of this chart are even still there. A much more reasonable starting point for a chart like this would be 1945 or 1950.

More importantly, this charts only the nominal value of the DJI. Total return, which is the only number that an investor should care about, includes dividends. I didn't easily find a DJI dividend history chart, but the S&P 500 dividend yield has ranged up to almost 10% and eyeball averages around 4%. (S&P 500 Dividend Yield by Year) Including dividends, IOW plotting total return, would change the chart substantially and lead to much less alarm.

To be fair to @RetireSoon he isn't the first and he isn't the last investor to have been mislead by this type of chart. I think they are mostly prepared and published out of laziness and ignorance rather than malice, but they can be badly misleading. I saw a variable annuity pitch one time where the huckster used one to claim that the S&P had yielded only 4% over a long period. He then went on to prove how wonderful his garbage investment product was.
 
Back
Top Bottom