Djia -800

But in the long term, I do think P/E reversion as Shiller and even Bogle keep warning us about is a real hazard.

Nah, that's just people predicting the end of the world. Again. Shiller and Bogle just aren't wearing sackcloth and shouting it from a streetcorner to passersby.

All these guys think that lower P/E can only come from P dropping. They never consider that it could also come from E increasing.

Doom and gloom sell.
 
....However, the wild volatility we are seeing is reminiscent of what takes place near the end. ...
Here's 20 years of VIX versus S&P (VIX is shown as 21.31 as of last Friday - the dates shown are truncated to month or something). Volatility looks rather middle-ish. I'm not seeing that 'wild volatility'. Can you point it out?

If I were forced to find a pattern, I'd say that volatility follows a decline, rather than being a leading indicator.

-ERD50
 

Attachments

  • VIX-S&P-1998-2018.png
    VIX-S&P-1998-2018.png
    87.7 KB · Views: 31
Last edited:
Nah, that's just people predicting the end of the world. Again. Shiller and Bogle just aren't wearing sackcloth and shouting it from a streetcorner to passersby.

All these guys think that lower P/E can only come from P dropping. They never consider that it could also come from E increasing.

Doom and gloom sell.

Neither Shiller or Bogle say E will not increase.

They say it cannot keep on increasing like it did, once the interest rate rises and there's no more tax cut to boost up earnings.

It's not the end of the world. It just is not as rosy as people hope for. If people think that it is the end of the world if they do not get 10%/year, then life will be indeed bad for them.
 
Last edited:
I've seen several posts on several different threads here about how everything is only going up this year due to the tax cuts and that next year we won't have that boost.


The tax cuts are not for 2018 alone - they will continue. Therefore, they will still have an effect on profits in future years as well. The only difference (excluding all other variables of course) is that the year-to-year increase in profits will not be as substantial as the increase from 2017 to 2018.
 
... the year-to-year increase in profits will not be as substantial as the increase from 2017 to 2018.

Exactly.

Hence, the return will be back to the normal range of a few percent, IF we have no recession.

And in the past, we had a recession every so often. No reason to think we have repealed the business cycle.
 
Last edited:
1. But are the economic fundamentals anything more than just a bunch of smoke and mirrors at this point?

The last leg of this overinflated bubble was a result of corporate tax cuts, which were completely unnecessary when record profits were already being posted. It was a gift, and is providing current year growth. Without it, we likely would be seeing flat earnings, or minimal growth. What it means for 2019 is that we likely will not see growth in corporate profits - it was a one-time boost and now that it's built in, we're not going to see the thrust it's given to earnings growth in 2018. Further, stock market gains and a peak in the housing market has made a good swath of the population "feel" extremely wealthy.

It's fairly easy to see that the housing market has peaked for this cycle. Go outside and look around your neighborhood - you'll see an abundance of houses on the market just within a mile radius. Lots of folks are wanting to sell - they see it's at a peak, interest rates are rising, and supply is now eclipsing demand. In NYC, folks are all racing to the exits - https://www.businessinsider.com/nyc...seen-since-financial-crisis-streeteasy-2018-9

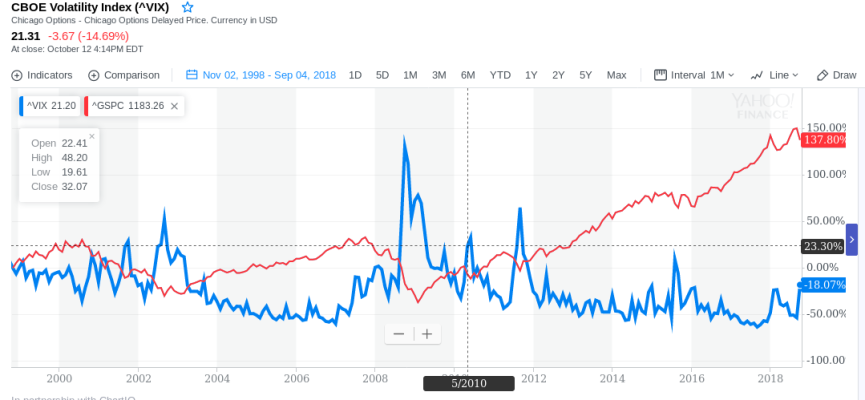
As for the stock market, maybe we've seen the peak of this bull cycle, maybe not. However, the wild volatility we are seeing is reminiscent of what takes place near the end. Regardless, there are a number of things taking place in this market which says it's a time for extreme caution, protecting gains, and not becoming complacent. Retirees who are sitting with their 60/40 portfolios (or even higher equity allocations) might want to take a step back and consider just how much risk they are taking. Should interest rates continue higher and the stock market head lower, both the equity and fixed income portions of the portfolio are going to decline in value.

2. While yield curve inversion has preceded the past several recessions, it is not required that inversion happen for us to have a recession. Recessions ultimately come about because of consumer and investor perception - no different than economic expansions. It boils down to optimism and pessimism.

We know that the Fed is extremely likely to continue raising interest rates over the next 12 months. As rates are continuing to push higher, this will gradually siphon money out of equities and in to fixed income. The higher interest rates go, the heavier it is going to weigh on equities.

On the economic front, as interest rates continue rising, it is going to slow economic activity. Housing and auto payments will cost more to those who finance (which is most purchasers). It will cost more for businesses to finance operations, leading to higher prices for the consumer. Additionally, with new tariffs, producers and manufactures are going to be passing the bulk on to consumers, further raising prices. With higher prices, consumers will cut back on their purchasing. Bottom line, inflation is going to continue rising. Though the Fed likes to say that we have about 2% inflation and they don't see it out of control, it actually is well above 2% for most households. The big ticket items households purchase weigh more heavily but are not included in government inflation calculations. Just wait until 2019 open enrollment for healthcare insurance next month and there's another 20% to 30% increase for most folks. College tuition for the kids - we all know those are out of control, rising about 5% a year at most schools. The list goes on.

You place your bets and take your chances. Yes, we are getting late cycle. Eventually you will be right...we will be heading down and will only know we are entering a recession in retrospect.

Housing peaked in 2006. Did the stock market peak in 2006? Nope. The SP 500 peaked in October 2007.
The Shiller PE 10 ratio is 31.28 as of 10/12/2018. On 1/1/1998, it was 32. 86. Was that the peak of the bull market? Nope.

So, I'm not saying we are in 1982 at the start of a great bull run. We were there in 2009, not today. But what I am saying the question of the day is whether we are at March 31, 2000 or maybe...just maybe we still back a way from the ending peak. For example, if we are closer to early 98 in terms of when the bull cycle runs out, we have another 46% or so upside. Or maybe we are having a repeat of the 91-92 cycle where we have a brief recession and then march higher.

Please understand me: I am not saying that it is a good time to go from 0% invested to 100% invested. I certainly wouldn't do that with my money. But, if I were forced to bet on whether we've seen the bull cycle peak or not, I would be on 'not', i.e. we will see higher highs before the next recession. [Being the conservative old fart that I am, I'm also sitting with 20% in cash plus another 10% in shorter duration bonds. ]
 
Heh heh heh...

Same as you, I am trying to get a bit more out of the market before that eventual crash and recession, although we all know we are in late cycle. And that's the danger. Investors all know this, and when "it" happens, it happens in a hurry. It always ends in a stampede. :LOL:

Market timing is tough, no doubt about it. :)
 
Market timing is tough, no doubt about it. :)

No it's not.

It's only tough if you try to look at things like an old-time oracle, peering at sheep entrails, etc.

Just look at the state of market price compared to where it was about a year ago. How about instead of trying to predict that the market will go down, look at if the market IS going down. Bear markets roll over slowly, there's plenty of time to get out before it falls off the cliff.
 
Originally Posted by NW-Bound
Market timing is tough, no doubt about it. :)
No it's not.

It's only tough if you try to look at things like an old-time oracle, peering at sheep entrails, etc.

Just look at the state of market price compared to where it was about a year ago. How about instead of trying to predict that the market will go down, look at if the market IS going down. Bear markets roll over slowly, there's plenty of time to get out before it falls off the cliff.

Sure seems like with that approach, you'd be at risk of getting out of the market and not finding a lower entry point. Those are hard to call. If it happens just once, you could get stuck for a very long time.

If it's so 'not-tough', where are all the successful mutual funds and ETFs beating the market with this strategy and drawing in billions of dollars?

So you are saying to sell if the market drops year over year to avoid any remaining bear? Or buy on that dip? Can you show a chart that matches your philosophy with your buy/sell points marked?


-ERD50
 
Last edited:
No it's not.

It's only tough if you try to look at things like an old-time oracle, peering at sheep entrails, etc.

Just look at the state of market price compared to where it was about a year ago. How about instead of trying to predict that the market will go down, look at if the market IS going down. Bear markets roll over slowly, there's plenty of time to get out before it falls off the cliff.

Oh, OK. I look forward to your in-advance buy/sell/hold market timing announcements. :greetings10:
 
Well I pulled the trigger on Friday. My 2018 ROTH hit my FIDO account and after 2 days of market decline, dumped it all in NHF. It was selling at a 9% discount to NAV, pays monthly dividends and based on the cost, should return 10.7% annual dividends.:D
 
Well I pulled the trigger on Friday. My 2018 ROTH hit my FIDO account and after 2 days of market decline, dumped it all in NHF. It was selling at a 9% discount to NAV, pays monthly dividends and based on the cost, should return 10.7% annual dividends.:D

Quite risky - but good luck with it.
 
Sure seems like with that approach, you'd be at risk of getting out of the market and not finding a lower entry point. Those are hard to call. If it happens just once, you could get stuck for a very long time.

So you are saying to sell if the market drops year over year to avoid any remaining bear? Or buy on that dip?
-ERD50

Well, I was responding to NW-Bound's comment "I am trying to get a bit more out of the market before that eventual crash...Market timing is tough"

I don't mean to be snarky here, but, geesh Faber's QTAA paper has been out for several years now. I have a copy of the 2006 working paper--that's 12 years ago.


If it's so 'not-tough', where are all the successful mutual funds and ETFs beating the market with this strategy and drawing in billions of dollars?
Don't care. Not my problem.

Market timing -- as Faber has said lots and lots of times -- it not for beating the market, it's for avoiding large bear markets. Which is what NW-Bound said he was trying to do.


Can you show a chart that matches your philosophy with your buy/sell points marked?
-ERD50
Yes. And no.
No because: The thing I use is specific to me. But Faber's paper explains it in depth, and I thing it probably has the charts you want to see.

Yes because: I do have a public spreadsheet that shows what you are looking for, once you set up the appropriate parameters to see just that. The signals are in the text of the SS but not marked on the chart.
Download form here: https://www.dropbox.com/s/cbzvg74iyeyfwt6/SPX-monthly-1950-2013-and-IUL-test.xls

In E6-E8, set your weightings, like 10/0/0.
In R1 & T6 set a date, like 1/1/1975. Or 1/1/1960.
In T1 set a starting amount, like $15,000.
Set T2 & T5 to $0..no additions or withdrawals.
Set J1 to the number of years you want to see in the chart. Like 35.


Here is the timing parameter:
Set O6 ("SMA sell") to 0.96. That means to sell when the S&P500 is 4% below the 12 month simple moving average. The buy signal is hardcoded at when the S&P500 is at or above the SMA.

So then look at the Chart tab.

Also, look at the statistics in T810-T817 (Buy&hold) and W810-W817 (timing).
For a start date of 1/1/60, the Maximum Drawdown (MaxDD) was -39% (B&H) vs. -23% (timing).
Success -- you reduced the worse drawdown by almost half, with little effect on the overall returns.

-----------
PORTFOLIO VISUALIZER will also show some things. Neither of these is exactly what I was talking about, but close--and you can see the effect of simple timing.

SMA vs. B&H https://www.portfoliovisualizer.com...eriodWeight=0&symbol1=VFINX&allocation1_1=100

12 month momentum instead of SMA
https://www.portfoliovisualizer.com...latilityPeriodUnit=1&volatilityPeriodWeight=0
 
Oh, OK. I look forward to your in-advance buy/sell/hold market timing announcements. :greetings10:

Hate to disappoint, but I do not offer that service.

Easy enough to do it yourself, though. Google is your friend. Everything you need to know is freely available on the web.

Per ERD50's request, attached is a table of the signals (1950 to 2016) from my actual timing method (which is similar although a bit more complex than what I mentioned). Couldn't figure out how to make it a table in the post.
 

Attachments

  • signals.txt
    1.8 KB · Views: 19
Interesting. Thanks. I need to read that Faber paper.
 
Hate to disappoint, but I do not offer that service.

Easy enough to do it yourself, though. Google is your friend. Everything you need to know is freely available on the web.

Per ERD50's request, attached is a table of the signals (1950 to 2016) from my actual timing method (which is similar although a bit more complex than what I mentioned). Couldn't figure out how to make it a table in the post.

So you've been 'out' since 12/18/2015? The S&P 500 is up 51% since 1/1/2016 (58.7% w/dividends reinvested). That's a 16.2 (18.3)% CGR that you've missed out on?

I guess my concern here is similar to what ERD mentioned...that the technique is at risk of missing out on good reentry points. Am i missing something here?
 
So you've been 'out' since 12/18/2015?

No, that spreadsheet just ends in 2015. The next BUY signal happened on 3/7/2016. I only showed the entire run of each buy or sell signal to the next signal.


I guess my concern here is similar to what ERD mentioned...that the technique is at risk of missing out on good reentry points. Am i missing something here?
Again, this is not timing for "getting in at the bottom". This is for sidestepping the bulk of large bear markets while being invested for most of the non-bear markets.

So it's not at all looking for "good reentry points". It gets back in when the market has stopped going down. That's triggered when the current price is at or above the 12-month ago price (or the 12 month moving average).

The thing that made Faber's timing method so different was that he explicitly was concerned more about trimming the losses than improving the gains. He bragged about reducing the volatility by half while reducing the gain only a little bit; therefore inmproving the risk-adjusted gain.

"Control your risk and let the gains take care of themselves."
 
Well, I was responding to NW-Bound's comment "I am trying to get a bit more out of the market before that eventual crash...Market timing is tough"

I don't mean to be snarky here, but, geesh Faber's QTAA paper has been out for several years now. I have a copy of the 2006 working paper--that's 12 years ago.


Don't care. Not my problem.

Market timing -- as Faber has said lots and lots of times -- it not for beating the market, it's for avoiding large bear markets. Which is what NW-Bound said he was trying to do.


Yes. And no.
No because: The thing I use is specific to me. But Faber's paper explains it in depth, and I thing it probably has the charts you want to see.

Yes because: I do have a public spreadsheet that shows what you are looking for, once you set up the appropriate parameters to see just that. The signals are in the text of the SS but not marked on the chart.
Download form here: https://www.dropbox.com/s/cbzvg74iyeyfwt6/SPX-monthly-1950-2013-and-IUL-test.xls

In E6-E8, set your weightings, like 10/0/0.
In R1 & T6 set a date, like 1/1/1975. Or 1/1/1960.
In T1 set a starting amount, like $15,000.
Set T2 & T5 to $0..no additions or withdrawals.
Set J1 to the number of years you want to see in the chart. Like 35.


Here is the timing parameter:
Set O6 ("SMA sell") to 0.96. That means to sell when the S&P500 is 4% below the 12 month simple moving average. The buy signal is hardcoded at when the S&P500 is at or above the SMA.

So then look at the Chart tab.

Also, look at the statistics in T810-T817 (Buy&hold) and W810-W817 (timing).
For a start date of 1/1/60, the Maximum Drawdown (MaxDD) was -39% (B&H) vs. -23% (timing).
Success -- you reduced the worse drawdown by almost half, with little effect on the overall returns.

-----------
PORTFOLIO VISUALIZER will also show some things. Neither of these is exactly what I was talking about, but close--and you can see the effect of simple timing.

SMA vs. B&H https://www.portfoliovisualizer.com...eriodWeight=0&symbol1=VFINX&allocation1_1=100

12 month momentum instead of SMA
https://www.portfoliovisualizer.com...latilityPeriodUnit=1&volatilityPeriodWeight=0

I realize you have not gotten a sell signal yet, but If I understood you correctly you are using a 304 day chart? I am not a LT holder, but found this very interesting and will be watching closely to see how it all pans out. I would personally like to thank you for sharing this with the community.

One other question: Your reentry into the market is based on your modified chart or on the original rolling twelve month chart referenced in the study?
 
Last edited:
Back
Top Bottom