Fidelity Retirement Analysis Tool

I believe the Fidelity Retirement tool assumes a 2.5% inflation rate for expenses.

What score above 100 would you need to have for an inflation rate of 8%?

It is based on a long term average of 2.50% inflation , not a year or 2 .

It also figures 4.90% or more on healthcare costs
 
It is based on a long term average of 2.50% inflation , not a year or 2 .

It also figures 4.90% or more on healthcare costs

Ok. So, the score provided by the Fidelity tool today is still relevant for the current inflation rate. So, there is no need to manic right?
 
Yes ..it is still valid ….the bond market is also guessing at a 2-1/2% range for inflation longer term as well
 
I first ran the Fidelity RIP over 8 years ago, before I retired.

I've been periodically checking it, seeing what the year by year balances that it projected would look like.

It's woefully out of date.

So I ran it again and it had most of my accounts but just editing them forced it to reprice everything.

For instance, for Vanguard, I edit and the balance jumped.

For smaller accounts at other institutions, I actually updated the number of shares to reflect the DRIP.

I didn't see an obvious way to change the inflation assumption though.

Back 8 years ago, I generated several tables with 3 and 3.5% inflation in addition to whatever the default was.

The original table had my Beginning Asset Value for 2022 at less than half of what it was. So it has me withdrawing over 5% last year.

I've been well under 1.5% in all 8 years since I FIRE'd.

The new RIP report makes you choose Average Market Conditions and Significantly Below Average Market Conditions.

So for instance, with Average Market Conditions, my Beginning Asset Value in 2023 is projected to be about 2-3% below my current asset value.

For Significantly Below Average Market Conditions, my Beginning Asset Value in 2023 is projected to be about 20% below my current asset value.:(

It also has me withdrawing 2.12% or 2.23% for 2023, Significantly Below Average or Average Market Conditions.

This year, I won't even come close to either figure.

How much can I rely on these projections?

Because it's indicating that I should be withdrawing and spending a lot more than I have been.

One problem that I see is that it sets the Social Security projection I put in (at age 62) and never increases that value in 34 years. It keeps it fixed:confused: under the Total Estimated Income column!
I'm using the Fidelity RIP tool for my retirement planning as well.

So based on your comments, the Fidelity RIP tool is very conversative on it's projections.

I will be retiring in the next 2 years. So if my score is above 100 today, it's safe to assume I will be OK in retiring in 2 years.

Is that a good assumption?
 
I first ran the Fidelity RIP over 8 years ago, before I retired.

I've been periodically checking it, seeing what the year by year balances that it projected would look like.

It's woefully out of date.

So I ran it again and it had most of my accounts but just editing them forced it to reprice everything.

For instance, for Vanguard, I edit and the balance jumped.

For smaller accounts at other institutions, I actually updated the number of shares to reflect the DRIP.

I didn't see an obvious way to change the inflation assumption though.

Back 8 years ago, I generated several tables with 3 and 3.5% inflation in addition to whatever the default was.

The original table had my Beginning Asset Value for 2022 at less than half of what it was. So it has me withdrawing over 5% last year.

I've been well under 1.5% in all 8 years since I FIRE'd.

The new RIP report makes you choose Average Market Conditions and Significantly Below Average Market Conditions.

So for instance, with Average Market Conditions, my Beginning Asset Value in 2023 is projected to be about 2-3% below my current asset value.

For Significantly Below Average Market Conditions, my Beginning Asset Value in 2023 is projected to be about 20% below my current asset value.:(

It also has me withdrawing 2.12% or 2.23% for 2023, Significantly Below Average or Average Market Conditions.

This year, I won't even come close to either figure.

How much can I rely on these projections?

Because it's indicating that I should be withdrawing and spending a lot more than I have been.

One problem that I see is that it sets the Social Security projection I put in (at age 62) and never increases that value in 34 years. It keeps it fixed:confused: under the Total Estimated Income column!

You say the tool has you withdrawing X% - you set the spend based on the budget you enter or an estimate of your expenses. So the tool is only as accurate as your input.
 
I'm using the Fidelity RIP tool for my retirement planning as well.

So based on your comments, the Fidelity RIP tool is very conversative on it's projections.

I will be retiring in the next 2 years. So if my score is above 100 today, it's safe to assume I will be OK in retiring in 2 years.

Is that a good assumption?

If your budget or expense estimates are correct.
 
You say the tool has you withdrawing X% - you set the spend based on the budget you enter or an estimate of your expenses. So the tool is only as accurate as your input.

Well it's having me withdraw more than the budget plus the Total Estimated Income.

It's as if it's calculating some kind of safe withdrawal rate, without necessarily accounting for the budget.
 
One problem that I see is that it sets the Social Security projection I put in (at age 62) and never increases that value in 34 years. It keeps it fixed:confused: under the Total Estimated Income column!

The default Display Settings is "Today's Dollars", so COLA'd items remain constant and non-COLA'd items decrease with future inflation.

Change it to "Future Dollars", and COLA'd items increase with inflation and non-COLA'd items remain constant.

Your choice.
 
If your budget or expense estimates are correct.

I have been tracking my expenses over the past 11 months now. I think I have a pretty accurate account of my expenses.

The only thing I can't figure out how to do in the Fidelity RIP tool is account for dividend income from one of the income sources that makes up my overall retirement income while withdrawing from the overall retirement income dollars.

As I withdrawn from my overall retirement income (sell shares), the dividend income will decrease over time.

Hopefully I explained that clearly.

Thanks
 
Last edited:
The default Display Settings is "Today's Dollars", so COLA'd items remain constant and non-COLA'd items decrease with future inflation.

Change it to "Future Dollars", and COLA'd items increase with inflation and non-COLA'd items remain constant.

Your choice.

Which setting do most folks choose ("Today's Dollars" or "Future Dollars")? I have a non-Cola pension, but Social Security is COLA'd.
 
Well it's having me withdraw more than the budget plus the Total Estimated Income.

It's as if it's calculating some kind of safe withdrawal rate, without necessarily accounting for the budget.

It’s adding in taxes.
 
I have been tracking my expenses over the past 11 months now. I think I have a pretty accurate account of my expenses.

The only thing I can't figure out how to do in the Fidelity RIP tool is account for dividend income from one of the income sources that makes up my overall retirement income while withdrawing from the overall retirement income dollars.

As I withdrawn from my overall retirement income (sell shares), the dividend income will decrease over time.

Hopefully I explained that clearly.

Thanks
You can enter income and expenses as well, for defined periods. I would maybe figure out the average value of the dividend stream and enter that over the period you expect to receive it. Keep in mind dividends are likely not a constant and may change.
 
For those folks that have a HRA (Health Reimbursement Account) starting at age 65 to help pay for Medicare premiums, Medicare supplement premiums, Medicare part D, and medical expenses, how do you account for that in the Fidelity tool?

My company will provide me a HRA worth $4500 per year starting at age 65. My wife will receive a HRA of $4800 per year starting at age 65 from her company.

You can enter income and expenses for certain periods of time under custom inputs. Add the start date/end date, if there is one, of the benefit and I would assume using all of it every year.
I added some medical insurance expenses, certain income streams that are for a finite period of time. They are all reflected in my results.

Can you provide an example. Maybe the exact screen to input this information.
 
Can you provide an example. Maybe the exact screen to input this information.

I am stepping out for the day and I will try and update later or maybe someone else can jump in to explain. Income can be added under income sources and you can define the years for start and stop. It’s pretty straight forward.
 
Can you just adjust your anticipated medical expenses and offset them by what the HRA will pay?
 
Maybe also time to look at the Quicken planner too.
 
Can you just adjust your anticipated medical expenses and offset them by what the HRA will pay?

I have estimated by Medicare premiums (Part A, B, &D) & expenses, and Medicare supplemental plan (Medigap) around $400 per month when I turn 65.

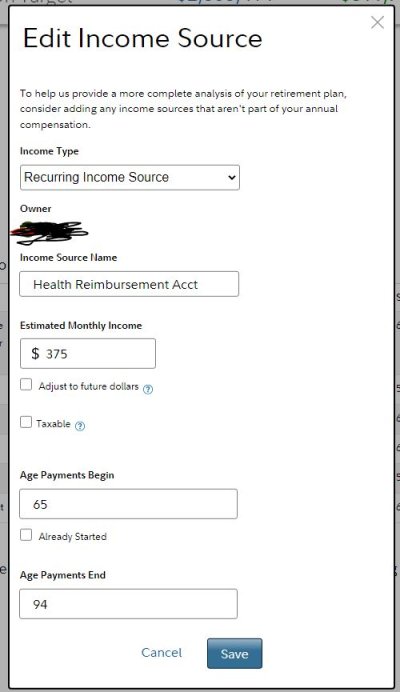
Based on suggestion in one of other the post, I have created a recurring income source starting at age 65 to 94 for $375 per month for my HRA ($4500 per yr).

Will that work as well?
 

Attachments

  • Capture_2022.JPG
    Capture_2022.JPG
    54.3 KB · Views: 20
Last edited:
Can you just adjust your anticipated medical expenses and offset them by what the HRA will pay?

I guess I could do that as well.

I have estimated by Medicare premiums (Part A, B, &D) & expenses and Medicare supplement plan around $400 per month when I turn 65. That is $4800 per year.

My HRA is $4500 per year starting at age 65. The shortfall is $300 per year.

I guess I could just estimate my Medicare premiums (Part A, B, &D) & expenses and Medicare supplement plan (Medigap) around $25 per month ($300) per year.

Not sure which approach is correct?
 
Last edited:
Well I did a test on both approaches.

If I adjust the Medicare premiums & expenses to offset them by what the HRA will pay ($25 per month ($300) per year), my Fidelity Retirement score goes up 6 points.

When I keep my Medicare premiums & expenses as-is ($400 per month) and create a recurring income source of $375 per month ($4500 per year) starting at age 65, my Fidelity Retirement score goes up 2 points.

So, I'm not sure which approach is correct.
 
Which setting do most folks choose ("Today's Dollars" or "Future Dollars")? I have a non-Cola pension, but Social Security is COLA'd.

I would guess the default, “Today’s Dollars”, is the setting most folks choose. I hardly ever look at “Future Dollars”.
 
We use future dollars for two reasons:

1.We have a non-cola pension and that amount then shows consistently as opposed to "future value"

2. We save the report in table mode and have an easy comparison for future years in terms of what we will have from where..i.e. ss..pension..IRA
 
We use future dollars for two reasons:

1.We have a non-cola pension and that amount then shows consistently as opposed to "future value"

2. We save the report in table mode and have an easy comparison for future years in terms of what we will have from where..i.e. ss..pension..IRA

If I select "Future Dollars", the "Assets at End of Plan" is about 3 times that of the "Today's Dollars" Assets at End of Plan .
 
Back
Top Bottom