funny investor sentiment graph

ladelfina

Thinks s/he gets paid by the post
Joined
Oct 18, 2005
Messages
2,713
Picture%2B9.png


found by way of:
naked capitalism

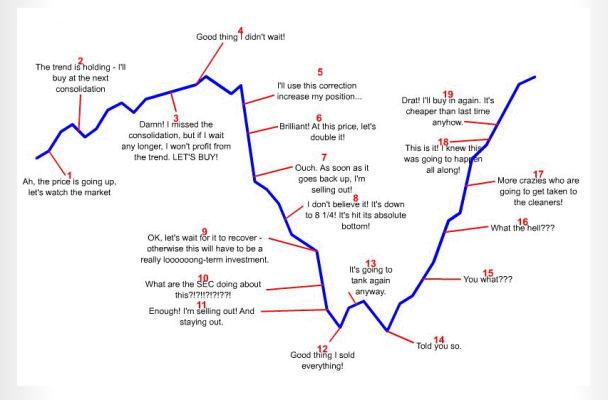
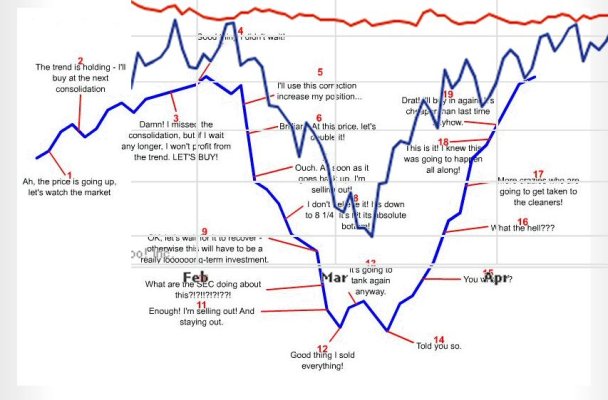
I don't think anyone who is honest with themselves has completely avoided having any of these reactions.. :)
 
Too true. We're our own worst enemy.
That's why I haven't bought any individual securities in about 8-10 yrs, and am thinking about selling the few I have left.

This graph should be required to be printed on every brokerage application form.
 
Thanks a bunch! After the past 2 months this explains so much!!! I already sent it to my one friend who can discuss the market with me. All my other friends prefer to work to pay an advisor like a bunch of lemmings, or are so far upside down in debt they wish we still had poorhouses.
 
hey, what happened to the graphic? It disappeared.
Boh.
Here is the linked link (to a link ;) ): Slope of Hope with Tim Knight
and a copy I nabbed:

(the original is back now.. oh well, at least it is now uploaded for posterity)
 

Attachments

  • investorgraph.png
    investorgraph.png
    166 KB · Views: 112
Well, I am depressed about the market so I am buying. We shall see if I am right or wrong.
 
I'm enthused about the market! Almost out of the weeds from the last 2 months. Life is good!
 
Last edited:
Very funny, and something I can personally relate to.

But, but, but, at this point in time, do you think we are at point #10 in the above graph, or at point #15?

Please help me, as I have no clue ... Maybe even point #6?:(
 
Very funny, and something I can personally relate to.

But, but, but, at this point in time, do you think we are at point #10 in the above graph, or at point #15?

Please help me, as I have no clue ... Maybe even point #6?:(

Between #14 and #15, if you ask me.

But my experience differs from around #14 on. What I've seen is that after about #14, news writers become disgusted or bored with the stock market and move on to another topic, like global warming, the Olympics, or the Russian invasion of Georgia, or whatever. The subsequent rise in the market is ignored until it sets new highs, then the cycle repeats with the journalists renewing their interest around #3.

2Cor521
 
I am obviously somewhere between ladelfina and 2Cor521.

Let's make it into a poll. This is going to be fun!
 
My guess, and it is only that, is that we are experiencing a bear market rally likely of relatively short duration, and we will eventually see new lows. This October could be cute! :)

But the snapback has been fun. Right or wrong, I have already cashed some gains in IRA.

Ha
 
Ha meant we are at point 13. Which means in the long run, it's not a bad time to buy.

I have been buying slowly the last 2 weeks. But then, I was working from a 52% cash position. So far, so good. Down to 48% cash.

P.S. I should add that for the last 2 weeks, my total has been pretty much constant, i.e. does not fluctuate nearly as much as the indices. What happened was that my various stocks moved opposite each other (energy+material vs. most other stocks), and canceled each other out. Is that good or bad?

Hopefully, when the market recovers, they will all participate and stop their tug-of-war! I have been buying some tech stocks.
 
Ha meant we are at point 13. Which means in the long run, it's not a bad time to buy.

NW, you may indeed be correct that we are at point 13, but that is not what I meant. I think the graph is cute and psychologically descriptive, but if I thought that we were at point 13 I would consider that "the bottom".

I do think that there are a lot of moderate values, but I also think that I at least need to see more blood. When I am scared sh*tless and thinking "why in hell didn't I just sell everything summer 2008?" -that is when I will try to buy for a good long time.

A poor earnings pre-announcement season this fall, or worse news on employment and production could get us there.

This may not even happen, but I will still be OK there too- not optimal but OK.

A person who is definitely not going back (or can't go back) to work needs to be careful. :)

Ha
 
Even if I want to buy, do I have any money left to buy?

One who has retired must think differently than one who is young and still accumulating. It slowly dawned on me that I have left the latter group, and joined the former.

When you have no new money to invest, it limits your choice, even if you have become arguably "wiser" with age.
 
Of course, it doesn't have to bottom at point 13 and top at 19. This could be a cutout of a much bigger graph. Just look at the S&P in '01 and '02. Hit bottom and then rose 20% - twice. Then it really went down. I remember that well and am still sore.

Not sure what point we're on the graph, but it sure feels more like '01 than '03 to me. Time to be cautious.
 
Personally, I think we're somewhere around #13 and we'll bounce around there for a while before the next and final leg down. I have been increasing my position in a few securities...cautiously.
 
Wonderful graph, teaches a lot, thanks. My bet is on #13. Seems like a lot of potential bad news hasn't come to fruition yet. But I'm trying not to let that affect my investing. Since I'm still working I can afford to keep buying and rebalancing into equities, as I have been since January.
 
That graph explains why the average equity or mutual fund investor makes around 1.5% (IIRC -- that figure from Brennan's Straight Talk book).
 
Love the buy in at the end... I know a lot of people who float around technical analysis and this pretty much describes what they believe. If it breaks through the resistance, it will take off... but if it falls through the support it will fall off. Okay... so if it goes up it is going to go up and if it goes down it will go down...
 
Wow - check this graph out 1 year later! We have ridden most of the graph during this time!

Thanks to MichaelB who linked to it on the Stock Picking forum today.

Audrey
 
Plus we had some of the same comments made.
 

Attachments

  • ChartComparison.jpg
    ChartComparison.jpg
    81.4 KB · Views: 42
Back
Top Bottom