I admit, I over analyze most decisions. Currently working through whether I get on the Retire in 2020 train or do OMY. As with most of you, my key concern is ensuring I have enough gas in the tank. So I’m building out three retirement cash flow scenarios (Best, Median, and Worst).
The key variables in the model are: Inflation (3.25%/3.50%/3.75%), Portfolio Return (5.0%/4.50%/4.50%), Social Security Haircut (No Reduction/10%/20%], and Yearly Spend before Taxes ($72K/$75k/$78k).
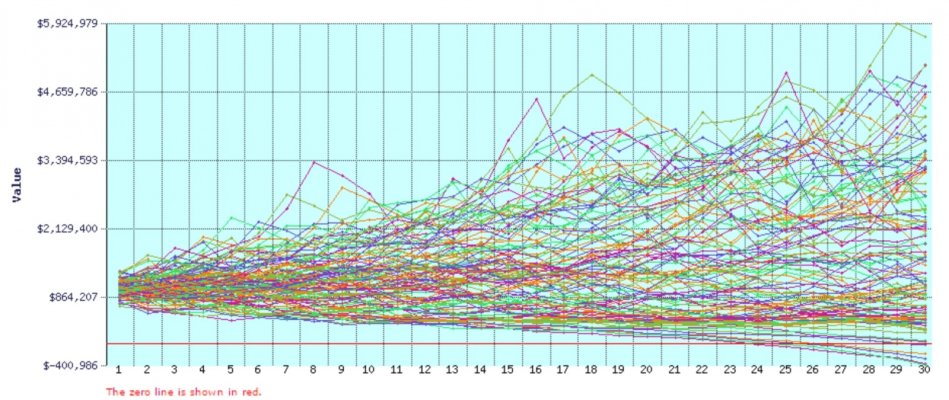
For each case, I have run through several tools (FIDO, Firecalc, Homegrown) and am solving for portfolio at our expiration date. All are fairly close for each scenario.
Question for the forum...are my inputs too aggressive/conservative? Are there other ways you finally reached your own conclusion?
My worst case exhausts the portfolio 2-4 years before expiration which is concerning. Thanks for your thoughts!
The key variables in the model are: Inflation (3.25%/3.50%/3.75%), Portfolio Return (5.0%/4.50%/4.50%), Social Security Haircut (No Reduction/10%/20%], and Yearly Spend before Taxes ($72K/$75k/$78k).
For each case, I have run through several tools (FIDO, Firecalc, Homegrown) and am solving for portfolio at our expiration date. All are fairly close for each scenario.
Question for the forum...are my inputs too aggressive/conservative? Are there other ways you finally reached your own conclusion?
My worst case exhausts the portfolio 2-4 years before expiration which is concerning. Thanks for your thoughts!