You are using an out of date browser. It may not display this or other websites correctly.
You should upgrade or use an alternative browser.
You should upgrade or use an alternative browser.
I'll Show You Mine, If You Show Me Yours...
- Thread starter Midpack
- Start date
obgyn65
Thinks s/he gets paid by the post
The pie chart is simple in my case : 100% in cash, CDs, and munis. I don't know how to create a graph similar to yours and then insert it in this post, sorry.
Why not, at least in this format?
yakers
Thinks s/he gets paid by the post
Nice chart. Are the bonds individual, a mix of fund types or all in one bond fund?
I tried the Morningstar program to show cap levels, foreign % and the like but could never get it to work. Several of my funds just don't have a NYSE ID or some way to enter them. I have the TSP G Fund which I consider a stable value fund but some see as cash. I have I Bonds (is it a bond or cash?) and some of my stocks were not loaded in the M* program when I tried it. So I never got it as precise and visual but I probably know as much as I need to to manage my portfolio.
I tried the Morningstar program to show cap levels, foreign % and the like but could never get it to work. Several of my funds just don't have a NYSE ID or some way to enter them. I have the TSP G Fund which I consider a stable value fund but some see as cash. I have I Bonds (is it a bond or cash?) and some of my stocks were not loaded in the M* program when I tried it. So I never got it as precise and visual but I probably know as much as I need to to manage my portfolio.
The pie chart is simple in my case : 100% in cash, CDs, and munis. I don't know how to create a graph similar to yours and then insert it in this post, sorry.
Me either! Besides, what fun would it be to see a solid green pie chart?
(100% cash that is).

NW-Bound
Give me a museum and I'll fill it. (Picasso) Give me a forum ...
- Joined
- Jul 3, 2008
- Messages
- 35,712
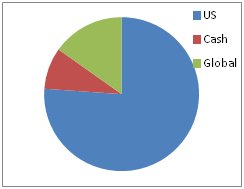
Sure, I'll play.
The asset classification was done by Quicken. It had some problems identifying some stocks ("no asset class"), such as Berkshire, and I am too lazy to go in and help it by entering the info myself.
You will also see that I have 25% "cash". That includes our I-bonds, some stable-value funds, money markets, etc...
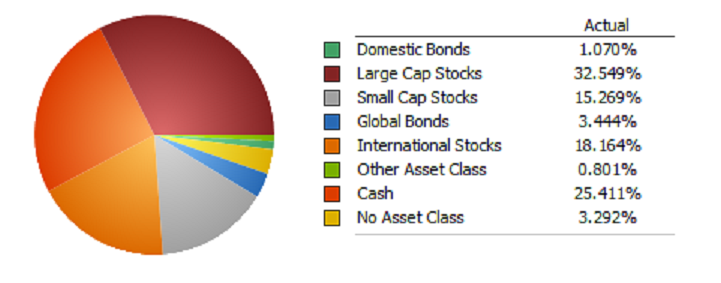
Well, I thought of it more like a pizza with only tomato sauce on it. Yes, perhaps one can live on it, but not too interesting to the palate. I am the kind who likes deluxe pizza with dozen of toppings myself.
The asset classification was done by Quicken. It had some problems identifying some stocks ("no asset class"), such as Berkshire, and I am too lazy to go in and help it by entering the info myself.
You will also see that I have 25% "cash". That includes our I-bonds, some stable-value funds, money markets, etc...
The pie chart is simple in my case : 100% in cash, CDs, and munis. I don't know how to create a graph similar to yours and then insert it in this post, sorry.
Me either! Besides, what fun would it be to see a solid green pie chart?
(100% cash that is).
Well, I thought of it more like a pizza with only tomato sauce on it. Yes, perhaps one can live on it, but not too interesting to the palate. I am the kind who likes deluxe pizza with dozen of toppings myself.
Last edited:
bbbamI
Give me a museum and I'll fill it. (Picasso) Give me a forum ...
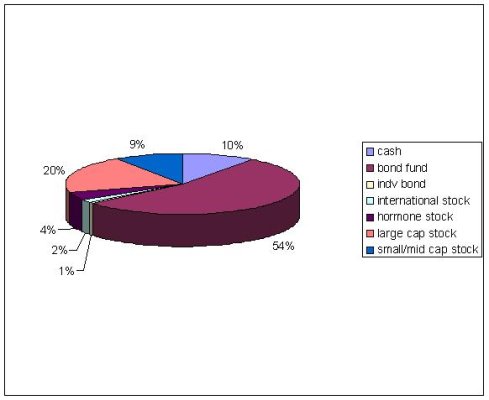
Egads...it's been years, YEARS I tell you since I've made a pie chart. 
My brain hurts.
This is as good as it's gonna get.....
(Edit to add....54/57 both retired. Pension covers 25 to 30% of yearly expenses. Low cost medical, vision and dental from Mega Corp. Both eligible for SS.)
My brain hurts.
This is as good as it's gonna get.....
(Edit to add....54/57 both retired. Pension covers 25 to 30% of yearly expenses. Low cost medical, vision and dental from Mega Corp. Both eligible for SS.)
Attachments
Last edited:
Hi obgyn65,obgyn65 said:The pie chart is simple in my case : 100% in cash, CDs, and munis. I don't know how to create a graph similar to yours and then insert it in this post, sorry.
I like muni's, what maturities do you favor? Thanks
OP
OP
Midpack
Give me a museum and I'll fill it. (Picasso) Give me a forum ...
All bond funds. And format isn't important, a table or list would be fine. I just have and like charts, a pie chart in this case. And there seem to be all sorts of investing approaches here, from no equity to all equity and everything between. All defensible...Nice chart. Are the bonds individual, a mix of fund types or all in one bond fund?
TromboneAl
Give me a museum and I'll fill it. (Picasso) Give me a forum ...
- Joined
- Jun 30, 2006
- Messages
- 12,880
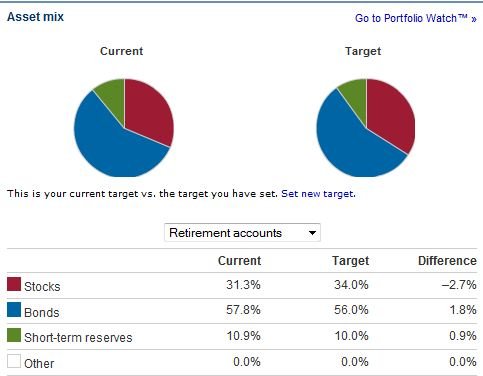
VG does all the work for me:

My target allocations are:
Energy 8%
Materials 2%
Frontier 4%
EM large growth 4%
EM large value 4%
EM small growth 4%
EM small value 4%
Foreign large growth 5.5%
Foreign large value 5%
Foreign small growth 9%
Foreign small value 8%
Foreign Real Estate 5%
US Real Estate 5%
US large growth 8.5%
US large value 8%
US small growth 7%
US small value 8%
Cash 1%
Currently I have extra cash, but the equities match within my rebalancing targets if you take out the extra cash. No bonds except incidental mutual fund exposure and much of the extra cash.
RetireBy90
Thinks s/he gets paid by the post
So I'm curious, seems youare already retired, correct?Why not, at least in this format?
And do you have any pension or SS?
Just to see what situation the AA goes with...
veremchuka
Thinks s/he gets paid by the post
How do you get that picture to post in your comment?
I use the screen capture tool, snippet, that comes with Windows 7. Then save the screen shot to a jpg file.
If you have XP you do a print screen and then paste into Windows Paint. Crop the segment you want and save as a jpg file.
In the post you then attach the jpg file.
If you have XP you do a print screen and then paste into Windows Paint. Crop the segment you want and save as a jpg file.
In the post you then attach the jpg file.
JmfromTx
Recycles dryer sheets
I don't know how to get a pie chart from a spreadsheet to an image. I'll break mine down into two groups.
Retirement accounts Roth and TIRAs
69.5 Bonds
15.9 Lg US Stock
6.6 Mid/Small US Us Stock
8 Int Stock
I don't like the small cap and international portion of these mutual funds but I've been procrastinating about making a change. I would prefer to own large US stocks for the equity portion.
Non retirement, money that should easily last me until SS at 65 (2019) and beyond, barring bad luck
29.7 Money Market
65.2 Short term bond
5.1 Lg US Stock
I keep one years spending in the bank also, split between a MM and checking account
Last edited:
Sirka
Recycles dryer sheets
pb4uski
Give me a museum and I'll fill it. (Picasso) Give me a forum ...
| Stocks | 56.2% | |
| Bonds | 37.5% | |
| Short-term reserves | 6.3% | |
Sirka
Recycles dryer sheets
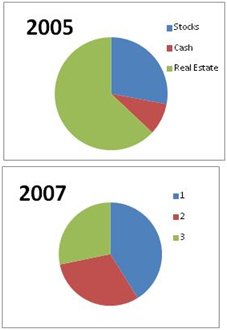
Before and After FIRE
I include RE in my charts. I am more balanced now (build a new house in 2007), but I was nervous in 2005, just before I sold and FIRE. RE was too much of our portfolio:
So I'm curious, seems you are already retired, correct?
I include RE in my charts. I am more balanced now (build a new house in 2007), but I was nervous in 2005, just before I sold and FIRE. RE was too much of our portfolio:
Attachments
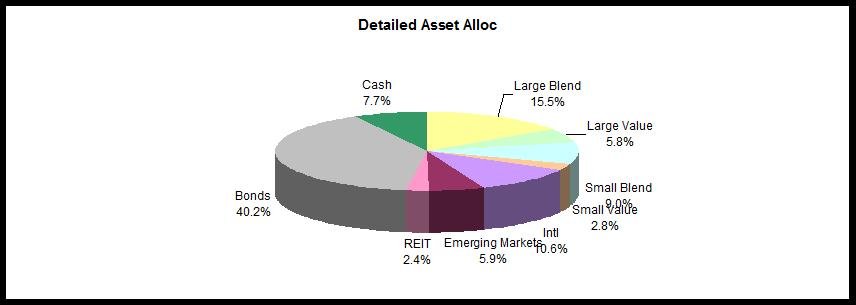
Here's Mine:
Foreign: 30% (18 % Large Blend, 5% Large Value, 7% Emerging Mkt)

US Large: 35% (14% Blend, 12% Growth, 9% Value)
US Mid/Small: 20% (6% Mid Growth, 7% Sm Blend, 7% Mid Blend)
Bond: 15% (10% US, 5% Global)
I'm probably 7 - 10 years from FIRE. Have been wondering about my 30% foreign exposure; recently dropped from 35%.
Foreign: 30% (18 % Large Blend, 5% Large Value, 7% Emerging Mkt)
US Large: 35% (14% Blend, 12% Growth, 9% Value)
US Mid/Small: 20% (6% Mid Growth, 7% Sm Blend, 7% Mid Blend)
Bond: 15% (10% US, 5% Global)
I'm probably 7 - 10 years from FIRE. Have been wondering about my 30% foreign exposure; recently dropped from 35%.
Dawg52
Give me a museum and I'll fill it. (Picasso) Give me a forum ...
I'll Show You Mine, If You Show Me Yours...
I would, but can't figure out how to copy the pie chart from Fidelity. Oh well, nothing much to look at anyway. Pretty conservative mix.
I would, but can't figure out how to copy the pie chart from Fidelity. Oh well, nothing much to look at anyway. Pretty conservative mix.
FreeAtLast
Full time employment: Posting here.
- Joined
- Apr 22, 2008
- Messages
- 702
Large Cap Equity 25.9%
Small Cap Equity 2.8%
International Equity 8.4%
Fixed Income 54.2%
Cash Investments 3.1%
Other 5.6%
Small Cap Equity 2.8%
International Equity 8.4%
Fixed Income 54.2%
Cash Investments 3.1%
Other 5.6%
From my profile:
Our ER portfolio is three ETFs and one stock: ~23% each of Berkshire Hathaway, EFV, DVY, and IJS. The remaining 8% cash is two years' expenses for bear markets and volatility swings.
No bonds, no REITs, no commodities. Cash flow from a 33-year-old rental that we may downsize to in 20-30 years. With COLA pensions & flexible expenses the rest of our ER portfolio can be way out on the risk/return curve.
~16% of our ER portfolio comes from our home mortgage, a 30-year 3.625%. It's invested in the small-cap value ETF.
Similar threads
- Replies
- 10
- Views
- 351
- Replies
- 3
- Views
- 449