modeling inflation - opinions ?

joesxm3

Thinks s/he gets paid by the post
Joined
Apr 13, 2007
Messages
1,322
I have been concerned with the effect of inflation and have watched some discussions that were showing the effect of inflation on your assets by focusing on the effective purchasing power of the total assets.

For example. $1,000,000 and 10% inflation

2021 $1,000,000
2022 $900,000
2023 $810,000
etc. with this being offset by the supposed rate of return on the assets.

I can see this being illustrative of the invisible drain of purchasing power by inflation, but it is different from the way I have been modeling inflation.

In some of my spreadsheets I have been making something along the lines of several columns for each asset class, say cash, stocks, bonds and assigning an expected rate of return to each class.

Each line would be a year, so I would add the previous year's earnings to get the asset value for the new line.

I would also have columns for expenses and taxes, which I would subtract from the cash column as I make each new line.

What I have been doing is to increase my projected expenses by the expected rate of inflation as I make each new line.

Given that my expenses are less than 3% of my total assets, it seems that the impact of inflation on the model is much less if I just apply inflation to my expenses.

If I subtract the rate of inflation from my total assets in order to represent the effective purchasing power of the future assets in today's dollars the effect is much more pronounced and very scary.

Do you think that using inflation simply to increase the projected annual expenses is the correct way to be modeling this?

Thanks.

Joe
 
Whether you model inflation by 1) shrinking the value of your asset, or 2) by increasing your withdrawal, it does not change the time when your asset gets depleted to 0.

You can try both to see this. The first is updating the value of your asset in today's dollars. The 2nd is computing it in nominal (inflated) dollars. They give the same number of years before you go broke.

But I see your point about 1) being more scary than 2). In your example, a 10% inflation on a $1M asset will result in it shrinking down to $900K the 2nd year, and $810K the 3rd year. But if you apply the inflation to the spending instead, say $40K for a 4%WR at the 1st year, then it will be $44K the 2nd year, and $48.4K the 3rd year.

Seeing that you lose $100K a year is more scary than seeing that you spend $4K more. However, the end result is really the same, whether you use constant dollar value or nominal dollar.
 
Last edited:
Whether you model inflation by 1) shrinking the value of your asset, or 2) by increasing your withdrawal, it does not change the time when your asset gets depleted to 0.

You can try both to see this. The first is updating the value of your asset in today's dollars. The 2nd is computing it in nominal (inflated) dollars. They give the same number of years before you go broke.

But I see your point about 1) being more scary than 2). In your example, a 10% inflation on a $1M asset will result in it shrinking down to $900K the 2nd year, and $810K the 3rd year. But if you apply the inflation to the spending instead, say $40K for a 4%WR at the 1st year, then it will be $44K the 2nd year, and $48.4K the 3rd year.

Seeing that you lose $100K a year is more scary than seeing that you spend $4K more. However, the end result is really the same, whether you use constant dollar value or nominal dollar.
Yes and I sure hope 10% inflation wouldn't be the norm. Ouch!
 
Thanks. I suspected that they might be the same, but sometimes I need someone sensible to double check my thinking.
 
It seems the emotional aspect of seeing 10% drop is what is tough for you to see in the spreadsheet. Rather than trying to model inflation as a separate item, isn't it easier to just model your net gain or loss in portfolio? As example if you figure on a long term growth increases of 6% per year, then if inflation is 10% your net is -4%. Just psychologically that is a lot easier to accept than 10% loss, even if you then increase by the growth of 6%. Final number is the same either way. Once you take your 3% withdrawal the complete net amount becomes -7%.

Logically the result is the same, but if you include inflation in the "growth" it might be easier to take the number. High inflation is bad for everyone.
 
Inflation is a major problem for retirees going forward. All the money pumped into the system finally comes back to bite us. If 10% plus inflation keeps on for a few years, we will have a serious problem.
 
It seems the emotional aspect of seeing 10% drop is what is tough for you to see in the spreadsheet. Rather than trying to model inflation as a separate item, isn't it easier to just model your net gain or loss in portfolio? As example if you figure on a long term growth increases of 6% per year, then if inflation is 10% your net is -4%. Just psychologically that is a lot easier to accept than 10% loss, even if you then increase by the growth of 6%. Final number is the same either way. Once you take your 3% withdrawal the complete net amount becomes -7%.

Logically the result is the same, but if you include inflation in the "growth" it might be easier to take the number. High inflation is bad for everyone.

In some of my pre-FIRE spreadsheets I figured in a -2% real rate of return, similar to what you were saying.

This year I had made some more detailed sheets to model ROTH conversions and RMD's.

Yesterday I figured to try to make a sheet that separated each asset class in order to model the effect of never ever again getting yield on fixed income or increasing my equity exposure.

When I did that with just increasing my expenses and taxes by the inflation amount I was surprised that, at least in the early years, it did not have much of an effect.

That made me wonder if some of the Youtube videos I had seen on inflation that focused on the decrease in buying power of an asset base were overstating things for effect. I suppose if I had better math intuition I would have immediately realized that the two were just different ways of displaying the same thing.

If they keep adding to the money supply and debasing the currency at the rate they have been lately, I don't think any version of the spreadsheet will keep me from worrying about it.
 
Yes and I sure hope 10% inflation wouldn't be the norm. Ouch!

Inflation is a major problem for retirees going forward. All the money pumped into the system finally comes back to bite us. If 10% plus inflation keeps on for a few years, we will have a serious problem.

Yes, high inflation is very scary, and it does not have to be at absurdly high level like the Weimar inflation or Zimbabwe, or the current inflation of Argentina (52.5%) or Venezuela (1575%).

Here's the last inflation bout in the US that many of us lived through, and still remember.

1973 6.2
1974 11.0
1975 9.1
1976 5.8
1977 6.5
1978 7.6
1979 11.3
1980 13.5
1981 10.3
1982 6.2

From Jan 1973 to Jan 1983, the dollar became 43c (prices increased 2.3x). The average annualized inflation rate of that decade was 8%.

Back then, I remember people buying gold, collectible like rare stamps, arts, etc... There was also an energy crisis, and people were installing solar water heaters, learned how to bundle up newspapers to a log to burn in their stove, etc...

Nowadays people buy crypto currencies, NFTs, and unicorn stocks. And energy prices are rising too.

Fun time!
 
Inflation is a major problem for retirees going forward. All the money pumped into the system finally comes back to bite us. If 10% plus inflation keeps on for a few years, we will have a serious problem.


Yes, and compounded by the fact that stocks are overvalued and will certainly come crashing down at some point, which is even more likely when the fed starts raising interest rates in the fight against skyrocketing inflation. Everything will cost more, and there will be less money in the stash. It's also not good for those with pensions that aren't adjusted for inflation. I'm thinking more people will have to go back to work.
 
Whether you model inflation by 1) shrinking the value of your asset, or 2) by increasing your withdrawal, it does not change the time when your asset gets depleted to 0.

True, but doesn't inflation affect spending differently that retirement assets (unless you are nearly all cash). I think it is more accurate to increase spending in the model according to an assumed inflation rate. But inflation likely has some other effect on asset prices in the retirement account that is different from consumer inflation... What exactly, I don't know. I'm sure some economist has studied this...
 
Inflation is a mechanism to redistribute wealth from savers and investors to the workers. It's because wages generally keep up with inflation much better than any investment.

Just yesterday, I read that there's wage growth across all demographic groups, but the one that went up the most was the 16-24 age group with 9.8% wage increase in 12 months.
 
True, but doesn't inflation affect spending differently that retirement assets (unless you are nearly all cash). I think it is more accurate to increase spending in the model according to an assumed inflation rate. But inflation likely has some other effect on asset prices in the retirement account that is different from consumer inflation... What exactly, I don't know. I'm sure some economist has studied this...

You are talking about the effect of investment gains of the assets. This is a different factor than inflation, yet the result is still the same with the two computation methods.

The easiest way to see this is to do both calculations with the same inflation number and investment return

With either method of calculating, the higher the investment return, the better the result. What the return factor does is to cancel out the inflation factor. The problem with high-inflation is that it usually causes difficult economic conditions for investments to do well. Of course, most investments did better than cash, but they still could not match inflation, and there was still a net loss.
 
Last edited:
My thinking is that inflation for consumer products is not the same inflation rate that would apply to the investment assets which of course shows up in how the assets appreciate or not. A stock is an asset with a price, but its price is likely not correlated in any way with the inflation rate, even on average as with index investing.

So to simply reduce the projected gains by the consumer inflation rate masks over this difference.
 
Last edited:
Inflation is a mechanism to redistribute wealth from savers and investors to the workers. It's because wages generally keep up with inflation much better than any investment.

Just yesterday, I read that there's wage growth across all demographic groups, but the one that went up the most was the 16-24 age group with 9.8% wage increase in 12 months.

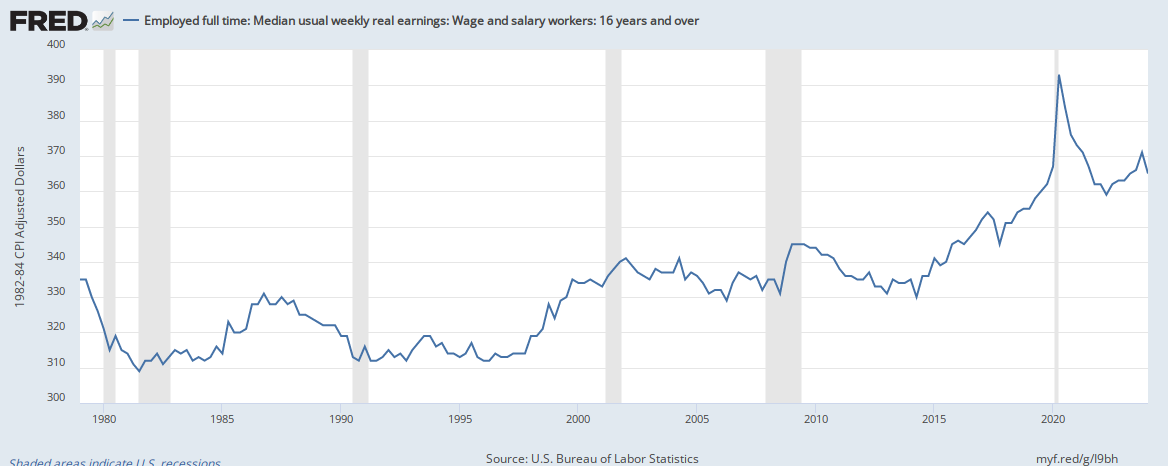
Data? In my 34 years of working, my wage never increased more than inflation. My military pay was tied to CPI. My private sector pay increases were always just at or below inflation. So my real annual wage increase over those 34 years was 0%.

The real wage index has done better than I did:

fredgraph.png


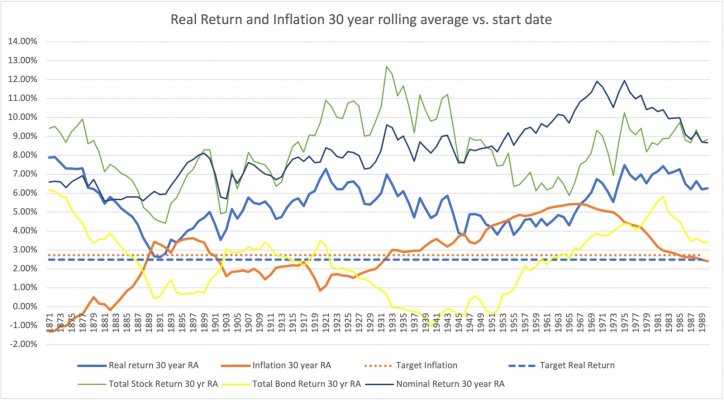
But the real return on a 50/50 portfolio did way better than any wage increases. There has never been a 30 year average of less than 2.73% real return on a 50/50 portfolio.
 

Attachments

  • real return.jpg
    real return.jpg
    334.8 KB · Views: 17
Data? In my 34 years of working, my wage never increased more than inflation. My military pay was tied to CPI. My private sector pay increases were always just at or below inflation. So my real annual wage increase over those 34 years was 0%.

The real wage index has done better than I did:

fredgraph.png


But the real return on a 50/50 portfolio did way better than any wage increases. There has never been a 30 year average of less than 2.73% real return on a 50/50 portfolio.

Your years of working were after the high inflation years of 1973-1983.

Wages did not rise higher than inflation then, but kept up with it a lot better than the stock market.
 
Last edited:
Your years of working were after the high inflation years of 1973-1983.

Wages did not rise higher than inflation then, but kept up with it a lot better than the stock market.

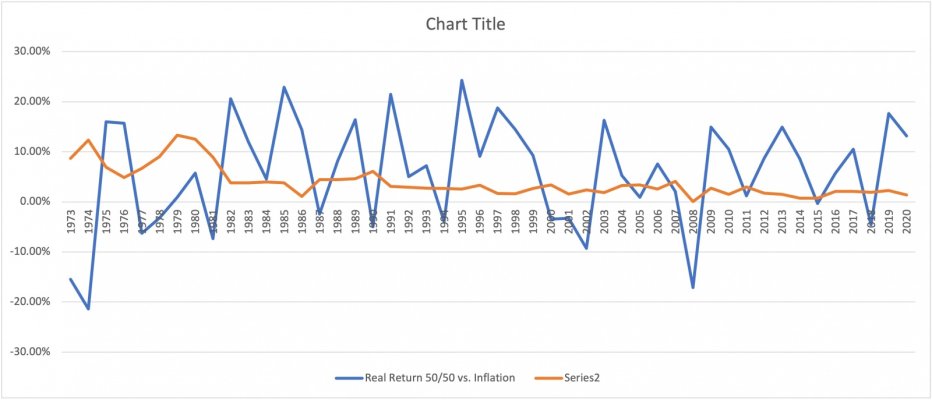
Yup, there was a sucky time from 1976-1981 where a 50/50 portfolio lagged inflation. Since then, it has wildly outperformed inflation.

To say it is a redistribution of wealth is a stretch, don't you think?
 

Attachments

  • Picture5.jpg
    Picture5.jpg
    188.4 KB · Views: 10
Yup, there was a sucky time from 1976-1981 where a 50/50 portfolio lagged inflation. Since then, it has wildly outperformed inflation.

To say it is a redistribution of wealth is a stretch, don't you think?


Only during high inflation, I again stress.

Inflation can easily knock off 50% of the dollar purchasing power, and of course it hurts people in cash a lot more than people having some stock or other hard assets. I do not dispute that.

But if a worker, particularly the low-paid rank, really lost 50% of the purchasing power of his pay, there would be a revolution and blood flowing on the street.

When inflation ran an average of 8% as in the period of 1973-1983 as I stated earlier, the stock market had to rise 8% just to match it. That's a high hurdle to jump.
 
Last edited:
Only during high inflation, I again stress.

Inflation can easily knock off 50% of the dollar purchasing power, and of course it hurts people in cash a lot more than people having some stock or other hard assets. I do not dispute that.

But if a worker, particularly the low-paid rank, really lost 50% of the purchasing power of his pay, there would be a revolution and blood flowing on the street.

When inflation ran an average of 8% as in the period of 1973-1983 as I stated earlier, the stock market had to rise 8% just to match it. That's a high hurdle to jump.

Agree.
 
Yup, there was a sucky time from 1976-1981 where a 50/50 portfolio lagged inflation.

Inflation has always been my main fear, since I watched it in real time.

When my grandfather retired, he had what was considered an excellent pension, but it had no COLA. When he died, the $1,000 he started receiving was worth only a little more than $200.
 
I started working full-time when out of grad school in 1980. In April 1980, I bought a house with a 14% mortgage.

Inflation was so high, my employer gave everybody 6-month salary adjustments. They had to keep offering higher and higher pay to new hires, causing an absurd result that new graduates were making more than their existing engineers. Hence, they had to give salary adjustments to everybody.
 
True, but doesn't inflation affect spending differently that retirement assets (unless you are nearly all cash). I think it is more accurate to increase spending in the model according to an assumed inflation rate. But inflation likely has some other effect on asset prices in the retirement account that is different from consumer inflation... What exactly, I don't know. I'm sure some economist has studied this...

I think the problem with this is there is not a way to independently model price inflation and investment returns with any accuracy.

Of course you can pick some assumptions and model it. But it comes down to how much you want to scare yourself. Modelling to make sure you understand the effects is valuable, but there is little there you can rely on as a forecast.

Looking at a real return on assets makes more sense to me.

Yes, "All models are wrong, but some are useful." George Box.
 
Speaking of actual return of the market during the scary period of 1973-1983, there was a recent thread where we talked about it.

See:https://www.early-retirement.org/forums/f44/wellsley-vwinx-inflation-spectre-111391.html#post2679672, and the follow-up posts.

Adding to the scare of high inflation is the extreme swing of the market return. The table below shows the inflation along with the nominal S&P return. You need to subtract out the inflation to get the real return. For example, the return of 1973 is -20%, and 1974 is -26%. In 1980, it's wonderful at 18%, then came -15% for 1981.

YearInflation (%)S&P return before inflation (%)
19736.2-14.7
197411.0-16.5
19759.137.2
19765.823.8
19776.5-7.2
19787.66.6
197911.318.4
198013.532.42
198110.3-4.9
19826.221.6

Imagine if you bailed out of the market after 2 terrible years of 1973-1974, you would miss out on the return of the next 2 years. But don't let these good 2 years fool you though. You still ended up the decade in the red, but it would be far worse if you got out of the market.

With high inflation, you can't win. Everyone is just trying to minimize losses.
 
Last edited:
I think the problem with this is there is not a way to independently model price inflation and investment returns with any accuracy.

Of course you can pick some assumptions and model it. But it comes down to how much you want to scare yourself. Modelling to make sure you understand the effects is valuable, but there is little there you can rely on as a forecast.

Looking at a real return on assets makes more sense to me.

I was made aware of this point recently when I tried to do a long term forecast from age 55-72. Nearly every point is a speculation. I was trying to guesstimate, what a portfolio of $1.8 mil would do @ 4% annual return and a 3% annual inflation rate. First year withdrawal would be 55K. DW and I would take SS @ FRA of 67, less 25% for any possible changes to the system. I was trying to see what RMDs would be and whether or not it would be beneficial to do Roth conversions.

After tens years, over, 75K now covered what the original 55K did and the overall balance found the tipping point and was now declining. Once I added SS @ 67 and needed to withdrawal less from the accounts, the total balance started to go up.

Again, this is all based on all speculation of what my balance will be in 4 years, market performance, inflation rate, changes to the SS system, changes to RMDs in 20 years, etc., but you have to have a road map to see where you want to go and then revisit it every year and make changes accordingly.
 
^^^^
Two other points:

1. Growth in interest rates (which I find useful.as.an inflation proxy) has historically had an undefined effect on markets. Generally when rates increase it is a signal for higher growth,which is positive for markets, as long as rates do not rise rapidly or continuously.

2. Tools such as Firecalc contemplate the bad markets of all types so it is a reasonable way to test your plans.

Of course, virtually all plans are blown up by true "hyperinflation" unless your investment portfolio is *geared* for it, in which it will likely fail in non-catastrophic conditions.
 
Back
Top Bottom