Perpetual Income?

A calculator I use in conjunction with Firecalc that I really like is called Rich Dead or Broke. It allows you to input a spending flex percentage thus allowing the spending amount in your plan when necessary to flex based upon the percentage set thereby increasing the likelihood of success for your plan.

In our case the biggest flex amounts in our budget are travel and dining out, which combined make up a healthy double digit percentage of our spending. If there were a market retreat or say even a pandemic, needless to say our spending would and has adjusted accordingly, which obviously affects the success rate of the plan, as opposed to say having a constant rigid withdrawal amount over the life of the plan.

Like Firecalc It also has the functionality to layer in other income or expense streams and apply beginning and ending dates to each of those streams. Additionally it brings in the death component to our planning which can also be eye-opening.

I use it and Firecalc in conjunction with my own spreadsheet in my routine financial planning and review. The link is provided below. See what you think...

https://engaging-data.com/will-money-last-retire-early/

Maybe I'm reading it wrong, but at the default setting lump sum with a 4% withdrawal, it doesn't provide a 100% success rate for 30 years.
 
A calculator I use in conjunction with Firecalc that I really like is called Rich Dead or Broke. It allows you to input a spending flex percentage thus allowing the spending amount in your plan when necessary to flex based upon the percentage set thereby increasing the likelihood of success for your plan.

In our case the biggest flex amounts in our budget are travel and dining out, which combined make up a healthy double digit percentage of our spending. If there were a market retreat or say even a pandemic, needless to say our spending would and has adjusted accordingly, which obviously affects the success rate of the plan, as opposed to say having a constant rigid withdrawal amount over the life of the plan.

Like Firecalc It also has the functionality to layer in other income or expense streams and apply beginning and ending dates to each of those streams. Additionally it brings in the death component to our planning which can also be eye-opening.

I use it and Firecalc in conjunction with my own spreadsheet in my routine financial planning and review. The link is provided below. See what you think...

https://engaging-data.com/will-money-last-retire-early/

Thank you for the link. It puts an interesting view on the future.

I like you are building a sheet that speaks to as much reality as possible. I've downloaded my spending from Chase bank in CSV format for the past several years. It shows me where my money goes, as I don't pay by cash, I use my card. This way I can select the items that will reoccur in the future as spending I'll have to anticipate.
 
I don't see anything wrong with the calculation. It will likely work as long as you don't have any unexpected expenses. Car accidents, hip surgery, long term illness, and similar exceptions will easily raise the annual spending above 16k and you will enter the negative growth of your net worth.
 
... I think you need to consider the impact of inflation on withdrawals ...
Yes. Here are a couple of 30 year scenarios:

After 30 years at the US historical average inflation rate of 3.11%, a 2020 dollar will have about 38¢ of buying power. IOW, your withdrawal rate of then-year dollars must be 2.5x your 2020 withdrawal rate just to stay even.

After 30 years at the Fed's 2% target it looks a bit better: Your then-year dollars will have 54¢of buying power, so your then-year withdrawal rate approximately doubles.

IMO all of us underestimate the effects of inflation, even when we have the numbers right in front of us. DW and I have been retired for around 15 years and we still marvel at how a restaurant lunch, no alcohol, could possibly cost $30! And inflation has been tame lately.

38349-albums263-picture2225.png

 
I don't see anything wrong with the calculation. It will likely work as long as you don't have any unexpected expenses. Car accidents, hip surgery, long term illness, and similar exceptions will easily raise the annual spending above 16k and you will enter the negative growth of your net worth.

This is very true. The unexpected. The calculation is in it's most rudimentary form. I'm adding to it, making a much larger sheet that has other inputs for monthly spending, inflation estimates, etc.

My ultimate experiment when I'm done with the sheet is to insert some larger expenses in various years after retirement, and see how the fund recovers. In reality you can outpace your working salary with some unforeseen expenses. There is no guarantee.

By looking at some of the calculators that have been shown to me, they add more insight to what I wish to build. The sheet would become an actual living calculation once retirement starts, and then I have a method to see where the trouble my occur in the event of unexpected spending.

I use spreadsheets for everything I do in life, even hobbies, etc. Best single tool I know of in the tool kit.
 
I think with a 2% rate of return and 1.93% WR that it is obvious that one would have a 100% success rate.... especially if withdrawals are not adjusted for inflation.

I think you need to consider the impact of inflation on withdrawals if they are you spending and the impact of pying taxes on RMDs even if you don't spend the RMD and other have pointed out.

Finally, I'm not quite sure what the point of the whole exercise is.


Again the impact of inflation in earlier years is greater than in later years. Given that the fed is struggling mighltly to get inflation to 2% and how low it has been for the last few years, it may be several years until it may even become a problem. If at least one theory is correct that rapid population growth is a requirement for high inflation the current static to declining population in the us could indicate that inflation might be low for a good while.
 
That's good info, I remember reading somewhere that there was a point of larger distribution. I wonder is it the same if you keep the funds in the 401k? I guess no real reason to move it to an IRA if I'm no longer contributing to it?

FYI, I'm 61, and am thinking of retiring in 2021 when I'm 62.


Actually after 72 the rmd increases as a percentage every year (Since the formula is essentially balance divided by the IRS version of life expectancy essentially the divisor starts at 27.3 years and decreases by .9 year a year for until age 80 when it moves to between .8 and .9 year subtracted each year. The table stops at a divisor of 2.1 ate age 114.
 
I haven't seen a link to the RMD calculator, so I'll attach. Sorry if I missed someone else's link.

https://www.irs.gov/pub/irs-tege/uniform_rmd_wksht.pdf

Back to the original topic, I think it is okay to calculate possible outcomes. It might give you some confidence. But as others have suggested a whole RANGE of such calculations have been done already and are the basis of FIRECalc as well as being the source of the so-called 4% rule.

My suggestion would be to become sufficiently familiar with the background of this work so that you can avoid any potential obsession with calculating scenarios - unless it brings you pleasure to do so. I don't intend to sound critical (heh, heh, most of us here have been steeped in this stuff for a decade or more!) As ever, YMMV.
 
My simple response, you have worked for your money, now time for your money to work for you.
I agree with the opinion you can withdraw higher than your proposed amount and still be safe; assuming you have invested in some mid-AA ratio. Like 40/60 to 70/30 will all allow the 4% rule to succeed.
X2 that RMD can and will catch you.
 
Agree, I'm putting a sheet together now that shows me what the balance is month by month with growth assumptions. Also the amount withdrawn each much adjusts for inflation. I'm using values that are higher than probable. That way I should be see better numbers in reality
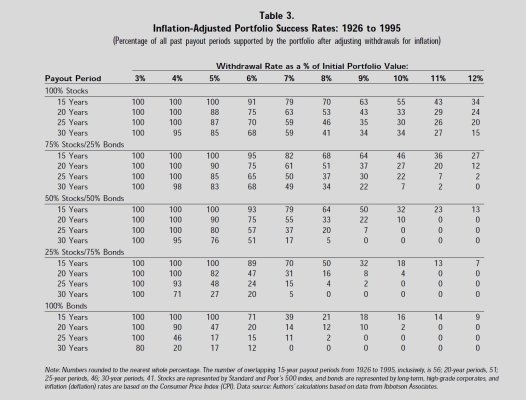
The exact process for the "4% rule" or in your case the 2% rule, was a little hard for me to understand too until I found the website I've linked to below. I believe the site's author was a member here a long time back. In any event, his very plain HTML tables do exactly what you want; they show the sequence of withdrawals over time adjusted for inflation. He plots them for a number of different portfolios and updates them once a year.

He stopped working at the end of 1994, so his main tables show how a 1995 retiree has fared. The short version is, they were all lucky duckys. Pretty much any investment strategy worked, including a portfolio of 100% fixed income. An ultra conservative investor in 1995 still has 81% of their original portfolio remaining after 25 years of annual withdrawals indexed for inflation.

But for the folks who started their retirement in 2000, just 5 years later, the results are quite a bit different. There are no sure losers yet, but these retirees are not nearly has comfortable as the class of 1995.

https://retireearlyhomepage.com/reallife20.html
 
I didn't notice anyone addressing the elephant in the room so I will take a shot. What most people fail to understand is the devil called inflation. Let's say inflation for that year is 2% then your "real" portfolio is back to $980,680.00. No-one can predict return and inflation for a given year. The difference between portfolio return and inflation (which can run negative for years at a time) has a cumulative effect that a no simple formula can capture. This is the primary reason "safe" retirement is very hard. Tools like FireCalc can help you run simulations using the past data but it is still relying on the past data. I hope you now realize the complexity of the retirement problem. The longer retirement period make this problem even more complex.
 
I didn't notice anyone addressing the elephant in the room so I will take a shot. What most people fail to understand is the devil called inflation. ...

Looks like you missed posts #25 and #29.

I think with a 2% rate of return and 1.93% WR that it is obvious that one would have a 100% success rate.... especially if withdrawals are not adjusted for inflation.

I think you need to consider the impact of inflation on withdrawals if they are you spending and the impact of pying taxes on RMDs even if you don't spend the RMD and other have pointed out.

Finally, I'm not quite sure what the point of the whole exercise is.

Yes. Here are a couple of 30 year scenarios:

After 30 years at the US historical average inflation rate of 3.11%, a 2020 dollar will have about 38¢ of buying power. IOW, your withdrawal rate of then-year dollars must be 2.5x your 2020 withdrawal rate just to stay even.

After 30 years at the Fed's 2% target it looks a bit better: Your then-year dollars will have 54¢of buying power, so your then-year withdrawal rate approximately doubles.

IMO all of us underestimate the effects of inflation, even when we have the numbers right in front of us.
DW and I have been retired for around 15 years and we still marvel at how a restaurant lunch, no alcohol, could possibly cost $30! And inflation has been tame lately. ...
 
Last edited:
I think with a 2% rate of return and 1.93% WR that it is obvious that one would have a 100% success rate.... especially if withdrawals are not adjusted for inflation.

I think you need to consider the impact of inflation on withdrawals if they are you spending and the impact of pying taxes on RMDs even if you don't spend the RMD and other have pointed out.

Finally, I'm not quite sure what the point of the whole exercise is.

This.
If your assumptions are accurate, then yes, this will work, but the only way I see a regular 2% return rate over the next X number of years would be to buy a SPIA, but then of course you lose the principle. Any mix of stocks and bonds will not behave this way, and I don't think you will find these rates in savings accounts, though I guess you could try to ladder CDs. If you are 50/50 (stocks/bonds) and we have a 50% downturn you will lose about 25% of the portfolio value.

Also, as was stated, you might want to figure in inflation or the spending power of your nominal withdrawals will erode.

I think you need to consult a calculator such as firecalc or others to model what can happen to different portfolios from a historical perspective. If your goal is to withdraw a nominal amount from your portfolio without ever having a dip in the balance, you will have to accept current FDIC interest rates which are under 2% as far as I am aware. Again, you will watch your spending power erode in this situation, or you will need to dip into principle.
 
Last edited:
Maybe I'm reading it wrong, but at the default setting lump sum with a 4% withdrawal, it doesn't provide a 100% success rate for 30 years.

The Trinity Study/4% still fails like 5% of the time over 30 year horizons
 
has anyone explored this as a safe way to have some money grow for the future?

I am thinking maybe you should start your own thread to discuss this? I could be wrong, but I don't see how this is related to this thread.
 
The exact process for the "4% rule" or in your case the 2% rule, was a little hard for me to understand too until I found the website I've linked to below. I believe the site's author was a member here a long time back. In any event, his very plain HTML tables do exactly what you want; they show the sequence of withdrawals over time adjusted for inflation. He plots them for a number of different portfolios and updates them once a year.

He stopped working at the end of 1994, so his main tables show how a 1995 retiree has fared. The short version is, they were all lucky duckys. Pretty much any investment strategy worked, including a portfolio of 100% fixed income. An ultra conservative investor in 1995 still has 81% of their original portfolio remaining after 25 years of annual withdrawals indexed for inflation.

But for the folks who started their retirement in 2000, just 5 years later, the results are quite a bit different. There are no sure losers yet, but these retirees are not nearly has comfortable as the class of 1995.

https://retireearlyhomepage.com/reallife20.html

Appreciate the link. Yeah I'm getting more comfortable with allowing the investments to do the work. Assuming no huge crash in our economy anyway.
 
Well I spent a few hours at the local Fidelity location in Northern Kentucky. They gave me a pretty decent report to take with me. It covers my investments, my SS payments, my expected cost to live, including everything I dumped out of my Chase bank account that wasn't just fun or wasted money.

The ran the investments as normal return average and then as way below average returns. In both cases I had money at age 89. One I have about 10% of what I stared with after 29 years. The other I was actually 1.8 time more than what I started with after 29 years. That means someone I like will have some money when I die. Of course in the event that it grows that way, I'll no doubt spend more.

I now need to get serious and start pricing health insurance so I know what to budget. And what It covers.

The Fidelity visit really help place some reality and trusted answers regarding what will most likely happen over time.


Fidelity has a major hub in Covington, KY. The report you described sounds like the Fidelity Retirement Planner tool on their website. It works in conduction with asset analysis and income planner tools. Maybe your version is more detailed. I did mine online but when I call in for help the reps have access to it. I’m still waiting for the new location near me to accept visitors.
 
That report was definitely the LIfetime Planner; the table view is very useful. I use it, Firecalc and Quicken Planner.


Fidelity has a major hub in Covington, KY. The report you described sounds like the Fidelity Retirement Planner tool on their website. It works in conduction with asset analysis and income planner tools. Maybe your version is more detailed. I did mine online but when I call in for help the reps have access to it. I’m still waiting for the new location near me to accept visitors.
 
Back
Top Bottom