Realistic Investment returns: 7-10 years

In re OP:
Pastafarian here.
Our basic needs and more are covered by SS, but we are drawings down our TIRA and my Roth.
I am figuring on 3% nominal for the next 10 years with no more than 3% inflation, if we make no changes.
Our horizon is 20 years.
If everything goes to Hell, we will make changes and be OK. We can make radical changes. Most people can't.
 
^^^ I am afraid that range is too high. :nonono:

I am admittedly in the more pessimistic camp. So, my projection is lower, with a range from 2.71828% to 3.14159%. And that is in nominal terms, so inflation will eat up some of that. >:D

However, the above is just 1 standard deviation, so the chance of going outside the above range is still quite high. It leaves people some room for praying. :bow:
 
Last edited:
Now, because my WR is so low at 1.5% (and I have not drawn my SS), the above meager market return can still support my WR.

In fact, my stash would still grow, not in real terms but due to inflation. And that will make me feel good already.

See how you are easier to please if you are not so demanding? :)
 
A low average return could also be the result of a decade of low volatility with low returns. It does not have to be a positive number either, could be a -2%.
Yes, conceptually a decade of low returns could be one with low returns each year. Since 1900, however, this has never happened. Every decade has lots of volatility, and the low return decades (1900's, 1910's, 1930's, 1940's, 1970's, 2000's) have had multiple double digit up and down years.

Really? I have never heard that. It seems even counterintuitive. Citation or link?
Peter Bernstein said the following on the Consuelo Mack show of Oct 21, 2005. He was a leading expert on financial risk.

I think something very important to think about this, that a period of low returns, you think, well, every year maybe we'll have 4%, 5%. It doesn't work that way. Low returns result from high volatility. You have a big year, and then a bad year, and the pattern of low return periods is high volatility, not low volatility.
Not true. A good AA will have non-equity assets specifically planned to use against SORR risks. Portfolio income from pension and SS is just one example.
Not true that high volatility is a worse case scenario for someone in early retirement with little or no non-portfolio income? You believe what you want, and I have no interest in engaging in a dogmatic argument. I'll just state my view differently and leave it at that.

For me, portfolio return is less important than portfolio survival. After two major market declines ('00, '08) it is clear (to me) that assets act differently in real life, not as I (and others) expected. My total portfolio volatility was much greater than it should have been based on all the asset allocation models. I am not particularly risk averse, but the one lesson I learned from those two market cycles is my financial plan works well with lower returns, but it doesn't work at all when volatility is extreme. I'll plan for lower returns as a byproduct of higher volatility and structure my portfolio accordingly.

I suspect the US Central Bank has designed much of their monetary policy effort to reduce asset price volatility, so they too see the corrosive effect of extreme volatility. This will work, until it doesn't.
 
What I learned from 2008-09 is that, in a real crisis, asset allocation is of no help at all. Correlations all run to 1.0, except for cash.
 
Eh, how do you dare argue against a Nobel laureate? :cool:

Anyway, is there any way you can divest of some of the shares if you think they are overvalued?
Ha ha..no Nobel laureate here; just a mid-level manager who used to attend meetings with the former company's global business unit leaders. I used to watch them chase performance in the company's acquisitions...while worrying about their quarterly performance and year-end bonuses.

Sure wish I could divest some of the shares I own, but they're held by the ESOP, until I turn 62!
 
Last edited:
What I learned from 2008-09 is that, in a real crisis, asset allocation is of no help at all. Correlations all run to 1.0, except for cash.

Where did you learn that? You might want to ask for a tuition refund.

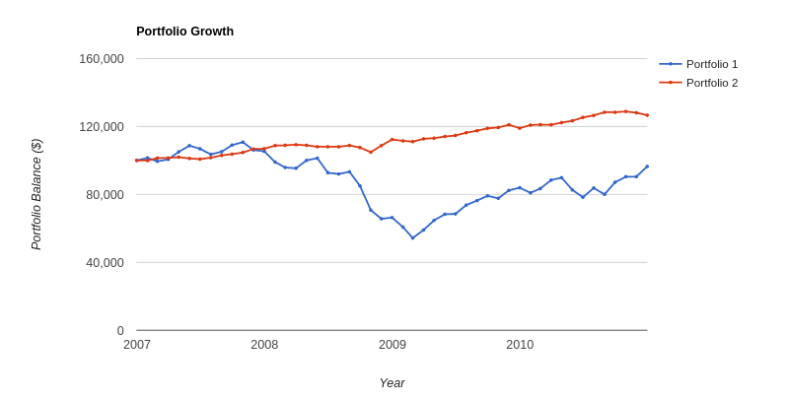
Bonds rose during that time, only a slight dip in the middle, eyeballing it, maybe a 0.1 correlation at the dip? But from 2008 start to 2009 end, it's a negative correlation (bonds rose, stocks fell). No where near 1.0.

Did you mean to say something else?

http://bit.ly/2M5GoJw << short link to data

-ERD50
 

Attachments

  • SandP_vs_BOND_2007_2010.png
    SandP_vs_BOND_2007_2010.png
    22.8 KB · Views: 32
Originally Posted by OldShooter View Post
Not true. A good AA will have non-equity assets specifically planned to use against SORR risks. Portfolio income from pension and SS is just one example.

Not true that high volatility is a worse case scenario for someone in early retirement with little or no non-portfolio income? You believe what you want, and I have no interest in engaging in a dogmatic argument. I'll just state my view differently and leave it at that.
...

You're not wrong (IMO), but I think what OldShooter was pointing out is that with a typical range of AA, in a downturn you pull from the fixed/cash side. So the volatility isn't as big a deal as many make it out to be. Sure, the higher the AA, you expect higher volatility. But you can draw from fixed for many years (after ~ 2.5% in divs, a 3.5% WR only needs to sell off another 1% per year). So a 70/30 has almost 30 years of buffer ( a bit less than 30 years, divs will dwindle as you sell more and more bonds, but... many years).

Since you didn't need to sell any equities, when they recover, you are right back where you were. It didn't matter, except on paper. Now, seeing your portfolio # drop might cause some angst, but it isn't a death sentence for the portfolio.

-ERD50
 
^^^ I am afraid that range is too high. :nonono:

I am admittedly in the more pessimistic camp. So, my projection is lower, with a range from 2.71828% to 3.14159%. And that is in nominal terms, so inflation will eat up some of that. >:D
Wow, 2 math constants in 1 post, nice.
 
Where did you learn that? You might want to ask for a tuition refund.

Bonds rose during that time, only a slight dip in the middle, eyeballing it, maybe a 0.1 correlation at the dip? But from 2008 start to 2009 end, it's a negative correlation (bonds rose, stocks fell). No where near 1.0.

Did you mean to say something else?

http://bit.ly/2M5GoJw << short link to data

-ERD50
Nope. I meant to say exactly what I said. From August 8, 2007 (picked because it was convenient and close to the market top) until January 31, 2009 (picked because it was convenient and close to the bottom), the S&P 500 Index dropped from 1453 to 825, a drop of 43%. During that same period, the Dow Jones Equal Weighted US Corporate Bond Index dropped from 1538 to 734, a drop of 52%. There may be minor variation because I am trying to put my cursor on a graph, but those numbers should be very close. And they show a correlation approaching 1.0
 
Both Gumby and ERD50 are correct, but they talk about 2 different things.

Corporate bonds crashed alongside stocks in 2008, but treasuries held steadfast.

I guess that's one big lesson that we need to remember. That is, for a buoy to dampen out the gyrations of stocks, we need something far better than corporate bonds. It has to be cash, treasuries, or gold.
 
Nope. I meant to say exactly what I said. From August 8, 2007 (picked because it was convenient and close to the market top) until January 31, 2009 (picked because it was convenient and close to the bottom), the S&P 500 Index dropped from 1453 to 825, a drop of 43%. During that same period, the Dow Jones Equal Weighted US Corporate Bond Index dropped from 1538 to 734, a drop of 52%. There may be minor variation because I am trying to put my cursor on a graph, but those numbers should be very close. And they show a correlation approaching 1.0

Both Gumby and ERD50 are correct, but they talk about 2 different things.

Corporate bonds crashed alongside stocks in 2008, but treasuries held steadfast.

I guess that's one big lesson that we need to remember. That is, for a buoy to dampen out the gyrations of stocks, we need something far better than corporate bonds. It has to be cash, treasuries, or gold.

Yes, but Gumby is putting a restriction in his explanation that wasn't there in his original statement. He said (emphasis mine) "asset allocation is of no help at all. Correlations all run to 1.0, except for cash.". The Dow Jones Equal Weighted US Corporate Bond Index is not just any asset, and it certainly isn't all assets. The vast majority of posts discussing asset allocation would refer to a Total Bond fund/ETF as a proxy for the 'fixed' side. And that is what I posted. Nowhere near a 1.0 correlation.

Maybe I missed it, but in a quick search, I didn't even find a fund/ETF that tracks the Dow Jones Equal Weighted US Corporate Bond Index. So who would have been invested in that anyhow?

-ERD50
 
Last edited:
Yes, but Gumby is putting a restriction in his explanation that wasn't there in his original statement. He said (emphasis mine) "asset allocation is of no help at all. Correlations all run to 1.0, except for cash.". The Dow Jones Equal Weighted US Corporate Bond Index is not just any asset, and it certainly isn't all assets. The vast majority of posts discussing asset allocation would refer to a Total Bond fund/ETF as a proxy for the 'fixed' side. And that is what I posted. Nowhere near a 1.0 correlation.

Maybe I missed it, but in a quick search, I didn't even find a fund/ETF that tracks the Dow Jones Equal Weighted US Corporate Bond Index. So who would have been invested in that anyhow?

-ERD50

It may be idiosyncratic, but I view US treasuries as essentially cash equivalents (more so at the short end, less so on the long end). I could have been clearer about that. My experience, and I would imagine that of others, is that pretty much everything went to crap at the same time back in 2008-09, except for cash and US treasuries. (Maybe gold, too, but I wasn't invested in it then and I haven't bothered to do the research)

I don't see why this should be such an issue for you, but, you know, you just go right ahead and be you.
 
While I practically have a PhD in spreadsheets, its still a lot easier to model with a single value in a single cell and play "what if?"
than it is to create a sheet that uses a range of values. ...

Sounds like your PhD program didn't cover two-variable data tables.

https://www.educba.com/two-variable-data-table-in-excel/

You could have one variable be nominal rate and the other be the inflation rate.... and other uses.
 
Nope. I meant to say exactly what I said. From August 8, 2007 (picked because it was convenient and close to the market top) until January 31, 2009 (picked because it was convenient and close to the bottom), the S&P 500 Index dropped from 1453 to 825, a drop of 43%. During that same period, the Dow Jones Equal Weighted US Corporate Bond Index dropped from 1538 to 734, a drop of 52%. There may be minor variation because I am trying to put my cursor on a graph, but those numbers should be very close. And they show a correlation approaching 1.0

Thanks for the details, I have a couple of funds like BSJM, which I suppose would drop like a rock (defeating my intent) in a downturn :facepalm:.
 
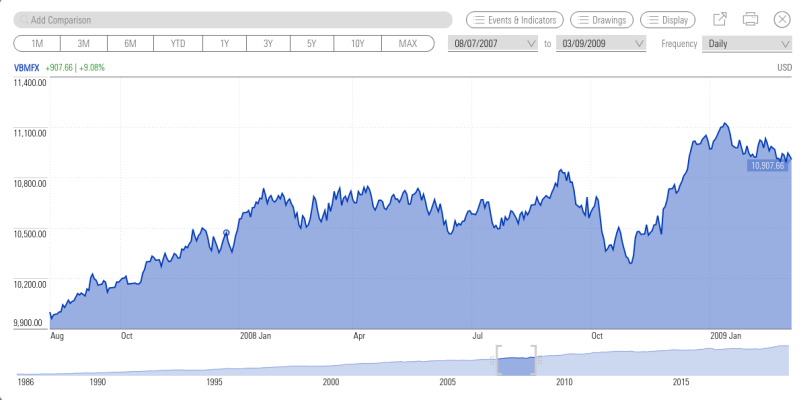
Total Bond Market Index (VBMFX) from Aug '07 to Mar '09:
 

Attachments

  • Screenshot from 2019-12-18 10-43-25.png
    Screenshot from 2019-12-18 10-43-25.png
    65.5 KB · Views: 38
Intermediate treasury funds were actually up almost 10% in late '08. I think short term was even better.
BND dropped 10% but only for a month. Maybe dropped 2% over 6 months.
I've been moving a chunk of the FI portfolio to an intermediate treasury fund. I'll give up a bit of interest for a few years of good night sleep when the time comes.
It may be idiosyncratic, but I view US treasuries as essentially cash equivalents (more so at the short end, less so on the long end). I could have been clearer about that. My experience, and I would imagine that of others, is that pretty much everything went to crap at the same time back in 2008-09, except for cash and US treasuries. (Maybe gold, too, but I wasn't invested in it then and I haven't bothered to do the research)

I don't see why this should be such an issue for you, but, you know, you just go right ahead and be you.
 
Sounds like your PhD program didn't cover two-variable data tables.

https://www.educba.com/two-variable-data-table-in-excel/

You could have one variable be nominal rate and the other be the inflation rate.... and other uses.

Of course it is natural to use a spreadsheet to produce a 2-dimensional array.

Let's see you do a 3-dimensional tensor. A 4-dimensional tensor? >:D

* A 3-D tensor can be shown with multiple sheets, but scrolling through the sheets will not give one the same feel of the variations like glancing at a 2-D table.
 
Last edited:
You're not wrong (IMO), but I think what OldShooter was pointing out is that with a typical range of AA, in a downturn you pull from the fixed/cash side. So the volatility isn't as big a deal as many make it out to be. Sure, the higher the AA, you expect higher volatility. But you can draw from fixed for many years (after ~ 2.5% in divs, a 3.5% WR only needs to sell off another 1% per year). So a 70/30 has almost 30 years of buffer ( a bit less than 30 years, divs will dwindle as you sell more and more bonds, but... many years).

Since you didn't need to sell any equities, when they recover, you are right back where you were. It didn't matter, except on paper. Now, seeing your portfolio # drop might cause some angst, but it isn't a death sentence for the portfolio.

-ERD50
To be clear, my key point was volatility reduces the annualized return of equities. So, a decade with an average return (SP500) of 4% could really be 0% return annualized. The difference is the product of equity price volatility. Every decade of low returns has had two or more years of >20% returns. The return we receive as investors is annualized, not average. The greater the volatility, the bigger the difference between average and annualized. So, volatility does indeed jeopardize portfolio returns.

Add to that, some asset classes have higher volatility than we have been led to expect. For example, high quality corporate and municipal bonds fell sharply in price in '08/09, as Gumby pointed out. Many safe assets fell in price and did not offer the protection or offset the risk indicated by all our asset allocation models.

If you are saying that traditional asset allocation of stocks and fixed income is fine and will protect portfolios from volatility, I strongly disagree. My view, however, is pragmatic, based on the experience of '08/'09, not financial modeling.

I do not disagree with the financial models, just think they do not cover all the realities we may face.
 
The only additional thing I would note is that the Trinity Study, one of the foundational documents for the 4% rule, used high grade corporate bonds as the fixed income component. If you are going to vary your fixed income from that, you need to accept the possibility that the study's conclusions may not hold for your situation.
 
To be clear, my key point was volatility reduces the annualized return of equities. So, a decade with an average return (SP500) of 4% could really be 0% return annualized. ...
Huh? What do you mean by "average" return and "annualized" return? I look only at total return (sticker price change + divs/interest).

For total return, the path from zero day to end day does not matter. Only the end point matters. So I don't understand your statement. Maybe an example?
 
Huh? What do you mean by "average" return and "annualized" return? I look only at total return (sticker price change + divs/interest).

For total return, the path from zero day to end day does not matter. Only the end point matters. So I don't understand your statement. Maybe an example?
Sorry, I though you knew. Average annual return is a simple average, while annualized reflects volatility. A 10% increase, followed by a 10% decrease, averages to 0, but annualized is -1%. This is critical when discussing volatility and projecting returns. Average returns is the thread topic and what most people have in mind when discussing future returns, annualized returns are what impacts our portfolios and determines future value.

To show the impact, let's project returns over the next decade to average 4.4%. If the annual rates of growth are the same as the decade of the 1940's (price only Shiller data) - the yearly returns were -14.2%, -15.4%, 13%, 17.4%, 13.8%, 33.6%, -15.6%, -2.5%, 3.6%, 9.9%. The average return here is the 4.4% we projected, yet the total return to our portfolio is 3.2% annualized, which means we have almost 11% less equity than we planned in our portfolio, even though the average return was at target.

Volatility reduces real portfolio return. This is why Peter Bernstein said low returns are the result of high volatility, and why I believe, for people in the withdrawal phase with a high dependence on portfolio income, high volatility is a worse case condition. Not the worst case, but very dangerous. While we focus on future returns, it's just as important to keep portfolio survival in mind.


Which is why people use CAGR and not averages.
 
Back
Top Bottom