SecondCor521
Give me a museum and I'll fill it. (Picasso) Give me a forum ...
It does intrigue me that the success rate goes up in firecalc the more conservative I get. 20/80 is 100% while 60/40 is 99%. But I can't resist getting some return for my heirs. I could go to a liability matching portfolio, but that seems overkill to me. I need $1.1M in today's dollars to fund all of my budget minus travel/blow that dough. I will have $800k in bonds when I retire (actually it's all in a stable value fund in my 401k yielding 2.1%). I figure that's close enough to safe with some upside for the kids.
The behavior you mention depends on the time period you select. For shorter time periods (10 years or so), bond heavy portfolios have relatively higher success rates than stock heavy portfolios. Personally I am looking at 30- to 40-year periods, and for those longer periods, stock heavy portfolios have higher success rates than bond heavy ones. The success rate for a 20/80 portfolio over 30 years is not as safe as 60/40 or even 80/20 using standard FIREcalc inputs.
As I've mentioned numerous times, my extra money is all in stocks. I figure my kids will inherit those funds in 30 or 40 years and may not even use the money then, so with that time horizon and risk capacity stocks are the way to go. I'd expect stocks to beat 2.1% over that timeframe, even if they happen to be temporarily down when I die.
is this it?
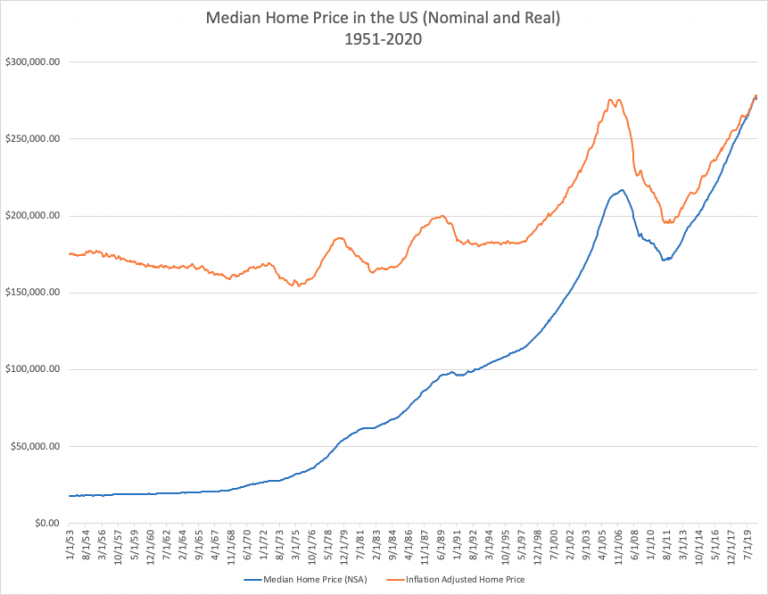
Looks like a reversion to mean is highly likely in the near future. IMHO.
It seems as though one would have to adjust for interest rates. A $250K home with a 7% mortgage is much less affordable than a $250K home with a 2.5% mortgage.
