Time to check year end taxes

Sandy & Shirley

Recycles dryer sheets
Joined
Jul 9, 2016
Messages
238
Location
North East

I did some work on my pre 2018 spreadsheet for marginal tax calculations, it uses the new tax brackets now and made it a lot simpler!

The new link on my google drive is https://drive.google.com/open?id=1d-DuA2x0D_GqdWzmp82L7qUhPT4wSpEM

If you like what I did, just follow the link (the chart will not look correct when opened in browser!), click the underscored down arrow download button, open in Excel, enable editing, and then save it to your disk.

The spreadsheet now has only 3 tabs, Marginal where you enter you data and see the results, and graph & graph2 where the now and what if charts are created for combined display on the first tab.

I use this spreadsheet during the year to avoid the now 49.95% and 40.7% marginal tax humps and I recently did a quick calculation for a surviving widow who was asking if she should pay off her mortgage before starting her Social Security.

Here is the marginal page I created for her!
18marginal.jpg


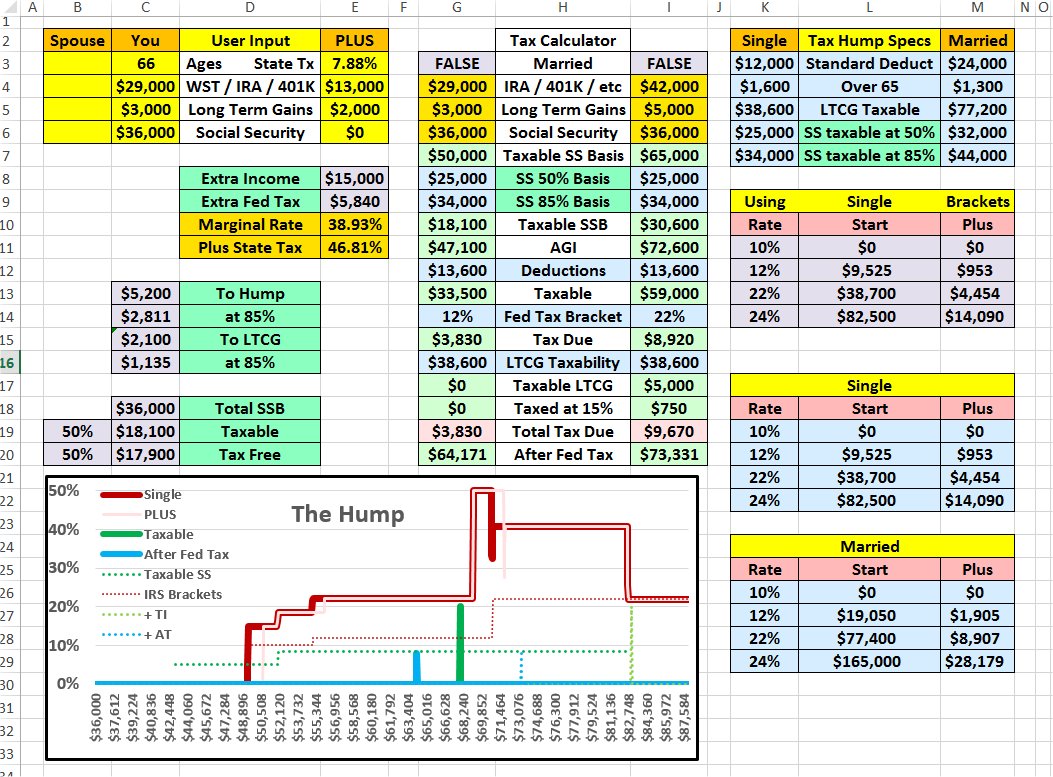
The only data she needed to enter (not real data here) were the yellow frames in the top left. We filled in the You column with her expected incomes, left the Spouse empty so it would use the single data from the 3rd set of tables, and then used the PLUS column to add in the amount that her house payments would drop when only making tax and insurance payments each year.

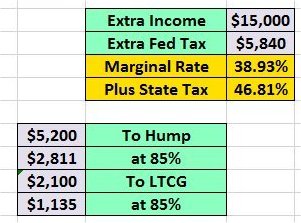
The middle “Tax Calculator” estimated her taxes due without and with the mortgage based on today’s tax brackets and the middle tables in the first set told her the results! Because her mortgage would push her into the large marginal tax humps, that extra $15,000 each year would raise her federal tax due by $5,840, a 38.93% marginal tax rate! She could afford $2,100 (To LTCG) of additional gross income before starting her 49.95% LTCG marginal rate, but since she is in the 85% SSB taxability range, the amount she could withdraw from her IRA would be limited to only $1,135.


18 answers.jpg


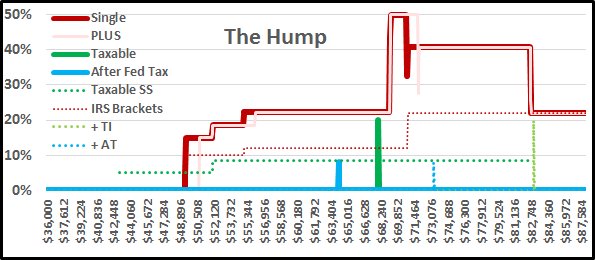
These numbers represent the combined Spouse and You input data. The other two excel tabs then build the graph that is visible at the bottom of the page. Its primary display is bold and represents only the spouse and you inputs. The lighter dotted lines illustrate how your taxes are effected using the PLUS column.
18chart.jpg


Plan A in this case, while taking her late husband’s very early relatively low survivor benefits, use the extremely smaller tax hump to withdraw extra cash from her 401K / IRA to pay off the mortgage before starting her own much higher benefits at a later age.

My personal case is different this year. We had some unexpected vet bills. The credit card will be due on Jan 1, we always auto pay 3 days early but can pay without late fees 10 days late. The extra withdraw would push us into our 2018 Marginal Tax Hump, so we will delay the card payment until Jan 8 and do our MRD on Jan 2 from our IRA in 2019 to get the extra cash to pay the bill by the before late charges!

I hope that others find this Marginal Tax Rate illustration spreadsheet as helpful as we do each year.

Any suggestions for improvements would be welcome. Feel free to share it with your friends, just let me know if you use it commercially.
 
I just downloaded it and it appeared to open OK in LibreOffice. I'll try to check it out and give you some feedback later today. I've had a little trouble following the 'hump' examples, so this should make the light bulb come on.

Thanks - ERD50
 
My marginal rate is 27% due to the stack (22%+ 15%) of ordinary income and qualified dividends. I didn't look at your spreadsheet but I don't see that in your graph.
 
As an aside, why are the single brackets shown twice?
I keep this hump concept in mind for future non ACA management of income. Thanks.
 
Thanks for the great spreadsheet! It confirmed what I suspected. RMD's will kill me if I don't do Roth conversions between FIRE and 70.5. I can pay 12% now or 24%+ @ 70.5.
 
The darker red single “Marginal Tax Rate” line represents you personal tax brackets including only the Spouse and You input columns. The lighter red line also includes the extra income from the PLUS column. This pink line starts $2,000 later due to the extra 2K of LTCGs in the PLUS column and the 49.95% marginal rate become wider to include the “triple taxation” of your income when getting both LTCGs and SSBs.

During this gross income range, an extra dollar of income from you IRA will also convert $0.85 of your previously tax deferred SSB from tax deferred to taxable income. Your gross income will therefore increase by $1.85, not just the $1 that you withdrew! The dotted red line shows that you are in the 12% federal tax bracket at this time, so you pay 12% of $1.85, 22.2 cents, in additional taxes, a marginal rate of 22.2%, BUT, this also pushed $1.85, not just $1, of your tax deferred LTCGs into their taxable region where they are also taxed at the special 15% level for those gains, 15% of $1.85 is an additional 27.75 cents. You marginal taxes due are now 12 cents on the dollar you withdrew PLUS 10.2 cents on the 85 cents of your SSB that became taxable PLUS 27.75 cents on the combined $1.85 of LTCGs that also became taxable. You are paying a total of 49.95 cents (12 + 10.2 + 27.75) on the single dollar that you withdrew from your IRA!

The 40.7% marginal bracket is caused by the 22% bracket on the $1.85, 40.7 cents!

In the normal federal tax brackets for a single person, your maximum tax rate is 37% if your taxable earnings is over $500,000, but if you are retired and getting SSBs, your maximum marginal bracket will be 49.95% for gross income less than $70,000!

Are you getting the picture of why I am so interested in the parallel taxation of multiple income streams at the same time which causes these huge tax brackets for us?
 
Thanks for the great spreadsheet! It confirmed what I suspected. RMD's will kill me if I don't do Roth conversions between FIRE and 70.5. I can pay 12% now or 24%+ @ 70.5.
Just be careful of your MAGI, Modified Adjusted Gross Income that is used to determine you Medicare payments. When you start Medicare they will look at your MAGI from your tax returns from 2 years prior. At age 65 they use your age 63 return. Try to limit your conversions after the age of 62!
 
The biggest problem that tax specialists do not want to tackle for every individual tax payer is that “The Tax Hump” is different for every one of their clients. It’s size and shape depends on the size of their individual or joint Social Security benefits, marital status, sources of income, etc.


Here is the table of hump sizes based on an individual with no LTCGs. All income is taxable from IRA, Pension, Annuity, etc. plus the size of their Social Security Benefit.
SingleNo TaxesBeforeHumpInHump
SSBGross 0%GrossNetSizeTax
$5,000$18,600$50,761$46,582$0$0
$10,000$23,600$52,408$48,122$0$0
$15,000$28,600$54,055$49,661$0$0
$20,000$33,600$56,865$52,411$1,841$749
$25,000$38,233$60,716$56,263$5,490$2,234
$30,000$42,400$64,568$60,114$9,138$3,719
$35,000$46,567$68,419$63,965$12,787$5,204
$40,000$50,733$72,270$67,817$16,436$6,689
Here is the same table showing the marriage penalty!
MarriedNo TaxesBeforeHumpInHump
SSBGross 0%GrossNetSizeTax
$10,000$36,600$94,038$86,506$0$0
$20,000$45,067$98,543$90,651$0$0
$30,000$53,400$102,893$94,659$0$0
$40,000$61,733$107,243$98,667$0$0
$50,000$69,818$111,703$102,796$238$97
$60,000$77,373$119,405$110,498$7,536$3,067
$70,000$84,929$127,108$118,201$14,833$6,037
80,000$92,484$134,811$125,904$22,130$9,007
 
As an aside, why are the single brackets shown twice?
I keep this hump concept in mind for future non ACA management of income. Thanks.

If you are seeing "Single" in cells K9 thru M14, those will vary based on inputs for spousal income inputs. If you have spousal income entered, then you will see the "Married" table replicated here. This appears to be the way he uses the correct tables for the user's personal situation.


Sandy and Shirley, Nice work! I wonder why you didn't include the highest 3 federal tax brackets? Maybe it is in there and I'm not seeing that?


I do most of my posting for upper middle income retired individuals.

Looking at the tables I just posted, single individuals with a SSB of about $17,500 do not even have what I labeled “The Hump”. Married couples just under the $50,000 SSB level also do not have The Hump.

The Hump ends when 85% of your SSB have become taxable income. That gross income level, per the tables, is $88,706 for singles and $156,941 for married couples. These numbers are close to the start of the 24% federal brackets, $82,500 single and $165,000 married, but those tables are based on taxable income, not gross.

My goal is to inform individuals that “The Hump” does exist and if one exists for you, what can you do to avoid paying “marginal” tax rates of 40.7% and even 49.95% when the highest federal bracket is only 37%.

Upper income individuals merely look over their shoulders and say that 15% of their SSB was tax free and they paid only 15% tax on their LTCGs. They do not take into consideration, they don’t need to, the marginal dollar for dollar tax rates that created those results.


Added later:


My year end example from the original post was only that I needed about $1,000 extra by 12/28 to make the full credit card payment. I would have to withdraw about $2,000 from my IRA, paying $814 to the fed and $170 to my state. Knowing this in advance means that I can wait until after Jan 1 to do my MRD and pay the fed only $444. I saved $370 because I knew what my limits are. It is not a huge savings, and that is why most CPAs don’t bother with this kind of spreadsheet.
 
Last edited:
In Libre Calc it displays better (graph labels, etc.) In Google Sheets all the results seem fine but the graph display drops labels.
 
Very helpful work sheet- thank you. It was nearly identical to what we expected, with the exception that we needed to add the self employment amount for our side gig.
 
Where do I enter qual/non-qual dividends and interest?

Does this 'hump' only apply to people collecting SS? I guess I'm confused.

-ERD50
 
Very helpful work sheet- thank you. It was nearly identical to what we expected, with the exception that we needed to add the self employment amount for our side gig.


The worksheet is just a starting point. The concept is what I was trying to convey. I also know that many government retirement plans interact in different ways with your personal SSB.


What I'm trying to do is give everyone a "picture" of their current and possible tax situation during retirement so they can start planning early.
 
Where do I enter qual/non-qual dividends and interest?

Does this 'hump' only apply to people collecting SS? I guess I'm confused.

-ERD50


Qualified dividends most likely go with the LTCGs while the non-qualified are just normal income like IRA withdrawals.

The hump also exists for those with only QDs and LTCGs, but it’s marginal rate only goes to 27%, 12% on the income that pushed the LTGs into taxation plus 15% tax on that deferred income. The real HUMP happens when you are in the 85% taxability range for you SSB. Even dollar you take out of your IRA while in that range increases your taxable income by $1.85 so the 12% bracket become a 22.2% marginal bracket and the 22% becomes 40.7%. Combining this with the 27% dual taxation with LTCGs and your marginal bracket reaches 49.95%.

Early retirement for some does not end up with early/low SS benefits levels. Shirley was able to retire on 79% of her survivor benefit and will jump to 129% of her own when she reaches age 70. She barely has a hump today, but it will be huge after age 70. The key is to recognize what the future “might” be and take the steps now to fix it.
 
Just be careful of your MAGI, Modified Adjusted Gross Income that is used to determine you Medicare payments. When you start Medicare they will look at your MAGI from your tax returns from 2 years prior. At age 65 they use your age 63 return. Try to limit your conversions after the age of 62!

I gotta disagree. For MFJ, stepping off the ACA cliff at $65K is WAY more consequential than $66/month IRMAA kicking in if MAGI happens to go over $170K. With ACA before and SS after, 65-70 is the prime time to do Roth conversions.
 
Qualified dividends most likely go with the LTCGs while the non-qualified are just normal income like IRA withdrawals.

The hump also exists for those with only QDs and LTCGs, but it’s marginal rate only goes to 27%, 12% on the income that pushed the LTGs into taxation plus 15% tax on that deferred income. The real HUMP happens when you are in the 85% taxability range for you SSB. .....

OK, thanks. I'll input that, and later will make entries for my future age 70/RMD estimates ( spouse and I turn 64 and 63 this year).

-ERD50
 
I'm a little confused by this at the moment.

What is WST in "user input" WST/IRA/ 401K?

omni
 
Last edited:
I'll pile on too.. what is SSB?

This "hump" concept alludes me, but defining some of the terms may help people like me catch up.

Thanks for the discussion.

Bob D
 
I downloaded the worksheet and matched my own calculation to the dollar. That was nice.

This also prompted me to review my RMD plan. For some reason, the RMD number that stuck in my head turned out to be different from the number I calculated back at the beginning of the year. Since the correct number is lower, and RMDs could push me into that 40% marginal bracket, the lower number was good.
 
Thank you for the spreadsheet. I have a question. I had prepared a similar spreadsheet for myself and this was a good check. I agreed with you for half dozen options in income. If I use $150,000 in IRA income and $20,000 in Social Security Benefits, single, over 65, I get almost $10,000 more in income tax due. I tried an outside calculator and got same. I hope I'm wrong.
 
Thank you for the spreadsheet. I have a question. I had prepared a similar spreadsheet for myself and this was a good check. I agreed with you for half dozen options in income. If I use $150,000 in IRA income and $20,000 in Social Security Benefits, single, over 65, I get almost $10,000 more in income tax due. I tried an outside calculator and got same. I hope I'm wrong.

31,106 from here https://www.mortgagecalculator.org/calcs/1040-calculator.php
 
Thank you for the spreadsheet. I have a question. I had prepared a similar spreadsheet for myself and this was a good check. I agreed with you for half dozen options in income. If I use $150,000 in IRA income and $20,000 in Social Security Benefits, single, over 65, I get almost $10,000 more in income tax due. I tried an outside calculator and got same. I hope I'm wrong.


Thanks for finding that error in the federal 24% tax bracket. I will update the excel file on my google drive later today. I also plan to add in the remaining tax brackets if possible.


My main target was a single page, landscape, report for those with end of year income levels near "The Tax Hump".
 
Back
Top Bottom