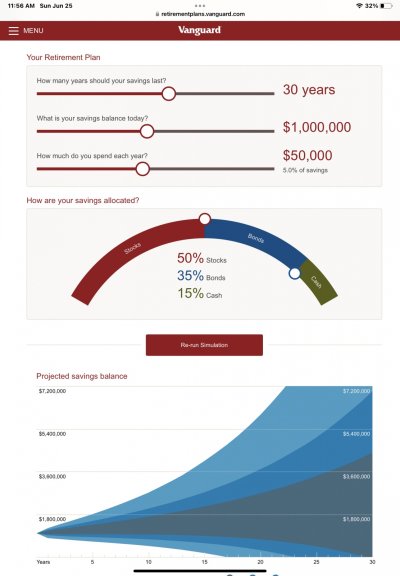
Vanguard Nest Egg Calculator

Midpack

Give me a museum and I'll fill it. (Picasso) Give me a forum ...
Joined
Jan 21, 2008
Messages
21,329
Location
NC

Attachments

  • IMG_2785.jpg
    IMG_2785.jpg
    249.5 KB · Views: 120
Yes it is.

I recall, back in the day, using something of the sort from "Money."
 
I think they are using a Monte Carlo simulator, which effectively results in a roughly 4% less successful result than a historical sequence based Firecalc type calculator.
This concept is in line with the differential I have experienced with the Fidelity based Monte Carlo simulator vs. Firecalc.
 
First time I ran it I answered this question, How much do you spend each year?
Then I realized I should answer this question instead, How much do you withdraw from savings each year?
 
First time I ran it I answered this question, How much do you spend each year?
Then I realized I should answer this question instead, How much do you withdraw from savings each year?

Yeah, I made that mistake as well. Big difference!:blush:

By the way, I can't vouch for the veracity of the calculator, but it certainly is easy to use.
 
First time I ran it I answered this question, How much do you spend each year?
Then I realized I should answer this question instead, How much do you withdraw from savings each year?
For some calculators, if you mean deduct any other income streams from the spending entry such as pensions, annuities, social security then you’re right - “spending” is only what you need from your portfolio. Of course FIRECALC will let you include other income sources to determine a (safe) withdrawal rate from your portfolio, so in that instance spending should be actual total spending. You’re right it’s something to clarify when using a given calculator.
 
Last edited:
For me it shows how much your asset allocation doesn’t really matter all that much if you are withdrawing less than you earn. I turn the dial from 20% equities to 70% equities and the outcome is almost the same.
 
Prior to unemployment/retiring I used every calculator I could find to get some sense of what I needed to save. At one point using 5 of the calculators from the "brand name sources" gave me:
2 saying I would run out of money
2 saying I would die with more money than I have now
1 goldilocks that had me running out of $ just as I hit my projected life span.
I eventually ended up with results from over a dozen calculators... I finally gave up and built a spreadsheet that simulated spending, inflation, and income for 30 years... I compared that to a rather simple PMT function and the results were the same.

Now days the big discrepancy in tools are for Social Security start dates. Financial Engines, Fidelity, OpenSocialSecurity.com, etc. all give results that do not match each other with several that don't match data from the SSA. So I'm back to building my own spreadsheets... instead of Social Security Administration is Spread Sheet Administration.

I reached a similar conclusion/experience, so also built my own. I've not yet plugged in a Monte Carlo or historical return simulation, but I can run downside cases for higher inflation, lower returns, etc. And its customizable for various liquidity events. I do like FireCalc though, and I like the BogleHeads Retirement Portfolio Calculator if you want to get real hardcore.
 
For me it shows how much your asset allocation doesn’t really matter all that much if you are withdrawing less than you earn. I turn the dial from 20% equities to 70% equities and the outcome is almost the same.

Long term? (Like 30 years) 20% to 70% should be about the same in survivability according to everything I've seen. Big difference is surviving balance. "Average" balances are huge with 70% though they can be quite small every once in a while in a given year.
 
Long term? (Like 30 years) 20% to 70% should be about the same in survivability according to everything I've seen. Big difference is surviving balance. "Average" balances are huge with 70% though they can be quite small every once in a while in a given year.

The tool just shows that if your goal is success of your plan vs maximizing return, then how much I have in equities is of little consequence.
 
It might be a new feature. Vanguard has been investing in improvements to its web presence.
 
It might be a new feature. Vanguard has been investing in improvements to its web presence.

That's been there for many years. It is too basic for anything but a quick check, but a nice tool for aspiring FI folks.
 
Back
Top Bottom