Withdrawal rates, age & probability of success

Generally I just state my 4% SWR choice since I'm not sure that there is a standard practice on this. Or is there :blush:? To me 4% SWR could apply to several approaches and I'd specify 2 of them as:
1) 4% of the inflation adjusted portfolio
2) 4% of the start of the year portfolio

another example would be:
3) 4% of the average of the portfolio the past 3 years

and it goes on, and on, and on .... Pick your poison. :)
Nothing wrong with the withdrawal methods you describe, but none of the above should be referred to as meeting 4% SWR methodology. There is a standard practice, there have been dozens of academic papers written (Bengen, Trinity Study, etc.) describing how it works Safe Withdrawal Rates - Bogleheads.

The 4% SWR methodology is as MichaelB described above. You never look at portfolio value after the first year (probably not wise, or practiced by many).
MichaelB said:
4% SWR means taking 4% from the portfolio the first year, then taking that same amount plus inflation every year after that, regardless of what % of the portfolio it represents.
 
Last edited:
Generally I just state my 4% SWR choice since I'm not sure that there is a standard practice on this. Or is there :blush:?

Not sure there is a standard practice, but if you take a look at the Trinity Study you'll see MichaelB's explanation of the 4% Rule accurately describes the result of that study.

The 4% refers to the portion of the portfolio withdrawn during the first year; it's assumed that the portion withdrawn in subsequent years will increase with the CPI index to keep pace with the cost of living.

Edit: Cross-posted with Midpack.
 
I guess when I see "4% SWR" I do think of the Trinity study. So I'll try to remember to stick with this convention and be a good rabbit -- I mean boy.
 
I guess when I see "4% SWR" I do think of the Trinity study. So I'll try to remember to stick with this convention and be a good rabbit -- I mean boy.
[-]Maybe[/-] I should lighten up, but I do see people confuse the 4% SWR methodology (Bengen, Trinity, et al) with various ways of withdrawing 4% from a portfolio each year. Right or wrong, I worry when I see someone confuse the two, especially newbies who are grappling with planning. As you know, the results from the two are vastly different.
  • If you follow the 4% SWR blindly (not recommended, it's just a theoretical roadmap), your income goes up every year and you would not have run out of money 95% of the time from 1871 thru 1981. You may leave a large residual, or less, or even run out of money 5% of the time (historically).
  • If you withdraw 4% each year blindly (also not recommended?), your income will flucuate up and down from year to year, but obviously you can never run out of money and you'll leave a large residual most likely.
In practice, most people do neither blindly. They adjust their annual withdrawals to smooth income from year to year somewhat, and increase or decrease their withdrawal rate over the long term based on how the portfolio holds up during the 30 year (or whatever duration) retirement - and what their bequest/residual plans are.
 
I'm sure Midpack will be along shortly to respond, but my take is not "all investment portfolios", but using the FIRECalc default:
FIRECalc will assume you want to keep your annual spending about the same for as many years as you specify, you aren't planning on receiving any Social Security or pension, and your retirement portfolio is invested in a "couch potato" portfolio of 75% stock index and 25% bond funds, with a 0.18% fee to the fund.
Who, upon retiring, keeps their portfolio invested 75% in stock mutual funds? Very few, I believe, based on the posters here. 50/50 seems more typical, and quite a few posters have a much smaller stock exposure in retirement.

The long-term survival results may not make a huge difference between say 40% equities and 75% equities, but I don't remember in the Firecalc case.
 
The long-term survival results may not make a huge difference between say 40% equities and 75% equities, but I don't remember in the Firecalc case.
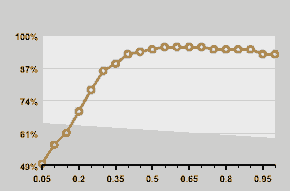
Same holds true for FIRECalc. This chart of FIRECalc results shows with an equity allocation of 40% or more the success of a portfolio is essentially flat, dropping a bit if above 80%:
 

Attachments

  • stock allocation graph.gif
    stock allocation graph.gif
    2 KB · Views: 100
Who, upon retiring, keeps their portfolio invested 75% in stock mutual funds? Very few, I believe, based on the posters here. 50/50 seems more typical, and quite a few posters have a much smaller stock exposure in retirement.

The long-term survival results may not make a huge difference between say 40% equities and 75% equities, but I don't remember in the Firecalc case.
In our case I ran two FIRECalc simulations and looked at detailed spread sheet results:
1) 65/35 with 4% withdrawal of the current balance
2) 40/60 with 4% withdrawal of the current balance

I found that #1 allowed me to spend about 10% more per year. While #2 did better in economically stressful decades. Those periods were 10 years in length starting in 1973 and 2000. The 1973-1983 period was followed by an economically good decade. We don't know what 2010-2020 will quite look like yet though it is starting out good.

Our current portfolio resembles #1 but if we get a period of excess returns (above 7% after inflation) in equities, I might drop back to portfolio #2. Should be an interesting ride. :blush:
 
Last edited:
In our case I ran two FIRECalc simulations and looked at detailed spread sheet results:
1) 65/35 with 4% withdrawal of the current balance
2) 40/60 with 4% withdrawal of the current balance

I found that #1 allowed me to spend about 10% more per year. While #2 did better in economically stressful decades. Those periods were 10 years in length starting in 1973 and 2000. The 1973-1983 period was followed by an economically good decade. We don't know what 2010-2020 will quite look like yet though it is starting out good.

Our current portfolio resembles #1 but if we get a period of excess returns (above 7% after inflation) in equities, I might drop back to portfolio #2. Should be an interesting ride. :blush:
Hmmmm - interesting strategy.

We're at 52.5% equities now, and very gradually reducing every year by 0.5% so that when we reach our 70s we have less equity exposure. At our rate that would be 45% equities at 70 which still seems pretty rich.
 
Last edited:
I was looking at Midpack's table, and thinking that we might increase our % withdrawal as we enter each new "survival" decade.

We're at 3.3% now, our ages average to 55. At 65 bump it up to 3.6%, at 75 bump up to 4.4%, etc.

We use the withdraw X% of portfolio value at beginning of each year method, not the classic SWR which only looks at the initial portfolio value and uses inflation to adjust withdrawals thereafter.

Withdrawal rates

Yrs retired|40| 30 |20|10
100% success|3.3%|3.6%|4.4%|7.0%
95% " "|3.7%| 4.0% |4.9%|8.2%
90% " "|3.9%|4.3%|5.1%|8.8%
85% " "|4.0%|4.4%|5.4%|9.4%
Retirement age approx |55| 65 |75|85
 
I was looking at Midpack's table, and thinking that we might increase our % withdrawal as we enter each new "survival" decade.

We're at 3.3% now, our ages average to 55. At 65 bump it up to 3.6%, at 75 bump up to 4.4%, etc.

We use the withdraw X% of portfolio value at beginning of each year method, not the classic SWR which only looks at the initial portfolio value and uses inflation to adjust withdrawals thereafter.

You can bump it up as part of your budget, but can you actually spend it? It is nice to know if our portfolios are declining slowly we can bump up our percentage withdrawals.
 
You can bump it up as part of your budget, but can you actually spend it? It is nice to know if our portfolios are declining slowly we can bump up our percentage withdrawals.
Sure! I already gift quite a bit of my annual withdrawal.

Gift it now, or gift it later.......
 
Same holds true for FIRECalc. This chart of FIRECalc results shows with an equity allocation of 40% or more the success of a portfolio is essentially flat, dropping a bit if above 80%:


I realize that there are dozens of ways to skin this cat...but just for being the devil's advocate, does that graph look different if you change it to a 3.3% WR (for a timespan of 50 years)?

I'm hoping to call it quits at around 45, and wouldn't initially do more than about 3.3% WR or so in the initial few years...which will hopefully be fully funded by just dividends from the equity portion of my portfolio. If that's the case, then I probably won't need to pare down the equity weighting to much lower than about 75% or so - depending on where rates are at at any given point in time and what the alternative equity dividend yields are offering.
 
I realize that there are dozens of ways to skin this cat...but just for being the devil's advocate, does that graph look different if you change it to a 3.3% WR (for a timespan of 50 years)?
You can get whatever outputs you need to build your graph by plugging your numbers into FIRECalc, then changing the equity percentages to match those on the posted graph.
 
Back
Top Bottom