Chart of the Day

FihK8aAXwAU2-WW.jpg
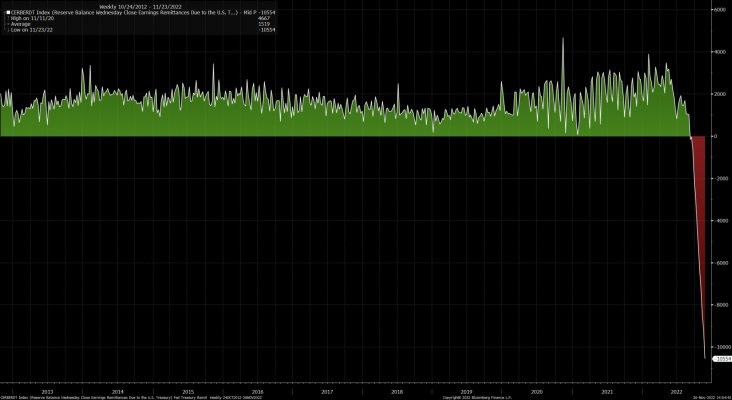
Federal Reserve Remittances to Treasury. With real interest rates and 2.5 TRILLION in overnight REPOS the FED is having to pay out money instead of making money. For any other bank this is the road to bankruptcy but it also highlights the issues with the overnight repo market if the FED needs to operate as a bankrupt organization to keep market from collapsing in high rates.
 
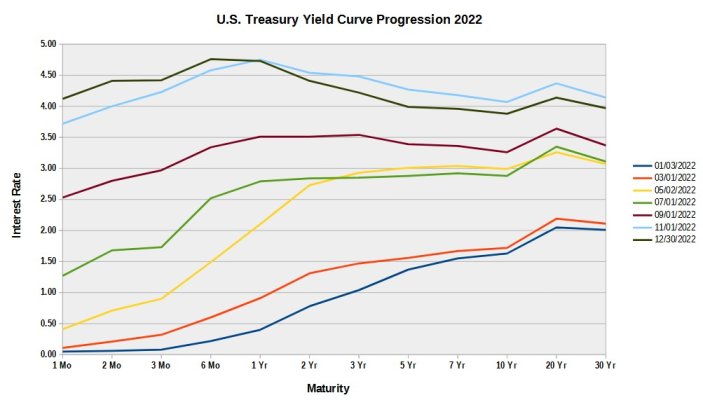
2022 Treasury Yield Curve Progression

Here's a chart I made to show the progression of the treasury yield curve over the course of 2022. Data is plotted every two months. It will be interesting to see how 2023 goes, but I doubt the move will be this dramatic again.
 

Attachments

  • 2022 Treasury Yield Curve progression.jpg
    2022 Treasury Yield Curve progression.jpg
    82.3 KB · Views: 79
Is the daily chart community still on new years vacation - or did they move to another forum?
 
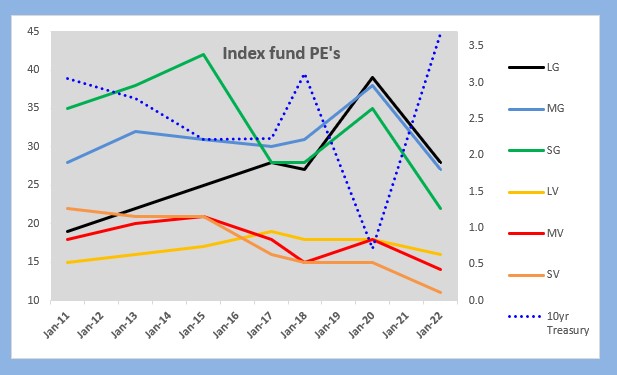
A chart I made from Vanguard PE ratio data for their various index funds.

LG / LV = large growth / value
MG / MV = midcap growth / value
VG / SV = small cap growth / value

plus the 10 year Treasury yield (Right axis)


image4.jpg
 
Last edited:
A chart I made from Vanguard PE ratio data for their various index funds.

LG / LV = large growth / value
MG / MV = midcap growth / value
VG / SV = small cap growth / value

plus the 10 year Treasury yield (Right axis)

image4.jpg

Ten year treasury yield is at 3.61%, not what is shown on the graph.
 
Ten year treasury yield is at 3.61%, not what is shown on the graph.

You are right, that data was for Nov 1 2022 but I should have put that at Nov 30 2022 (the PE date) which was 3.68%. Still not a big issue for the purposes of this chart. I'll correct that on my chart for any future use.

EDIT: I reposted the chart to the previous post and added an Oct 2018 data point as well. This update shows the date tick marks better too.
 
Last edited:
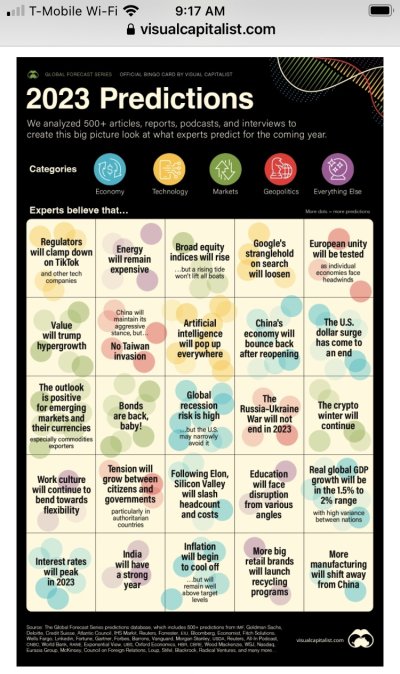
Prediction Consensus: What the Experts See Coming in 2023

To supplement marko's chart, here is the article: Prediction Consensus: What the Experts See Coming in 2023
Experts are reasonably good at predicting the future one year out, though they are also in a strong position to help shape the future through their influential thought leadership and actions.
https://www.visualcapitalist.com/predictions-2023/

Article seems to touch upon all the popular topics around here.
 
To supplement marko's chart, here is the article: Prediction Consensus: What the Experts See Coming in 2023
https://www.visualcapitalist.com/predictions-2023/

Article seems to touch upon all the popular topics around here.

Very few risky takes in there. The China economy and the google take were the biggest maybe's (IMO). Surprised some expert didn't predict the sun rising 365 times in 2023. No prediction on the chart suprised me is what I'm saying. With that being said, thanks for posting.
 
Last edited:
Very few risky takes in there. The China economy and the google take were the biggest maybe's (IMO). Surprised some expert didn't predict the sun rising 365 times in 2023. No prediction on the chart suprised me is what I'm saying. With that being said, thanks for posting.
I agree with your take. If nothing else we can throw darts at it.

I went to find the link because many graphics here don't load properly when I click on them. Has something to do with my browser blocking trackers.
 
I agree with your take. If nothing else we can throw darts at it.

I went to find the link because many graphics here don't load properly when I click on them. Has something to do with my browser blocking trackers.

Appreciate the effort. Nothing really actionable on there but good to see it anyway. My eye balls like to see charts and graphs and then my mind has to process instead of just written narrative.
 
Interesting book that I have not read. Looking at some reviews it appears to be a pessimistic view of automation. I prefer cautious optimism.
You better not worry about Automation. That is overestimated.
Read a book about the impact of self service, this is much worse than automation.


Illustration:
What does ATM stand for?
Automated Teller Machine


Instead of asking a guy on a counter to withdraw money from your account, you are serving yourself.

It is self-service that kills the jobs, not the automation.
If I may highlight the importance of the ATM in this comparison, withdrawing money yourself without an ATM is called a bank robbery.
 
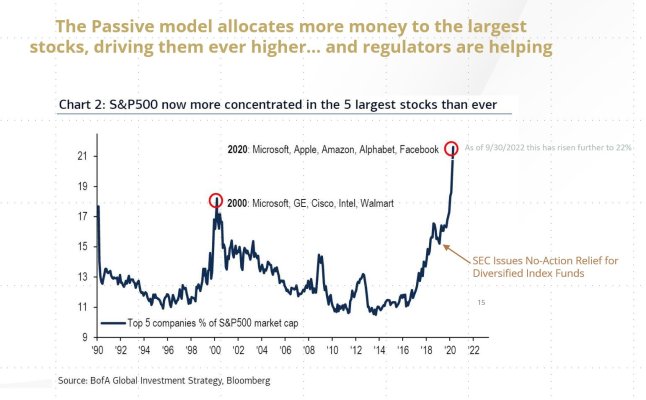
Concentration continues. 57% of the Nasdaq 100 is just 7 stocks, while the S&P500 is as below..
 

Attachments

  • Fr7zUrjagAA7oPA.jpg
    Fr7zUrjagAA7oPA.jpg
    122 KB · Views: 67
A chart I made from Vanguard PE ratio data for their various index funds.

LG / LV = large growth / value
MG / MV = midcap growth / value
VG / SV = small cap growth / value

plus the 10 year Treasury yield (Right axis)


image4.jpg


Nice graph.

If you plot the inverse of the Treasury yield, you will have something directly comparable to the stock P/E.

For example, a yield of 2% is equivalent to a P/E of 50, and 4% is equivalent to a P/E of 25.
 
Concentration continues. 57% of the Nasdaq 100 is just 7 stocks, while the S&P500 is as below..


Well, if you believe Cathie Wood, then in 10 or 20 years, Tesla will grow to take over much of the S&P. FAANG stocks no more. :)
 
Looks like a 10-year cycle approximately, wherein mega cap takes hold, only to burst. Then the cycle repeats.

A study might look at the top stocks in passive vs active funds. Mayve one could find evidence that active managers know when to rotate out of a company like GE, before it implodes.
 
View attachment 44220
Federal Reserve Remittances to Treasury. With real interest rates and 2.5 TRILLION in overnight REPOS the FED is having to pay out money instead of making money. For any other bank this is the road to bankruptcy but it also highlights the issues with the overnight repo market if the FED needs to operate as a bankrupt organization to keep market from collapsing in high rates.

Very interesting chart. When you said the Fed is having to pay out money instead of 'making' money, I assume you were referring to printing ?
 
Very interesting chart. When you said the Fed is having to pay out money instead of 'making' money, I assume you were referring to printing ?

Well they are printing it previously they were reducing the interest expense of US by returning the money the government was paying itself. Now they are paying banks more than the interest earned from the treasury notes they hold
 
Back
Top Bottom