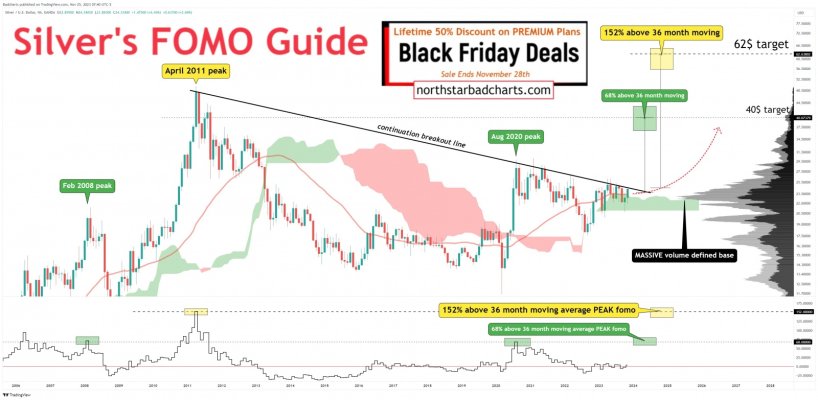
Silver could have major move up
As far as charts go this is a good one for relative valuation, which is comparing present price to the 36 month moving average. 2009 went from 9-42 and in 2020 went from 11 to 27. This chart is similar to the CRB index when the CRB broke it's 12 year downtrend in 2021 foretelling of an increase in commodities, which are up 60% since then. This chart is for a sales pitch, which I am not interested in but the chart of the price action is very informative. Advantage is price should move up very soon exceeding $25 is the first sign, if price falls back below $21 then this move is not going to occur and you would exit the trade, so there is a clearly defined trade that shows very large upside promise and limited and clear downside losses. These opportunities are rare, similar to March 2009 stock market or the CRB breakout described above.