Inflation and new FRED info

Well, that's not for horse p*** regular at a convenience store or anything like that. It was for the highest (premium, 93 octane?) grade of Exxon gasoline, at a convenient Exxon in an urban location. It's the gas station I am used to going to, since it's close to my home. The point you were supposed to get from my post was not that my gas station offers a huge bargain, but that the gas price didn't budge by even one cent a month later. Apparently I wasn't too clear. :)

Has your gas price gone up at all in the past month? Ours hasn't. And yet, according to mass media, we should be freaking out at how gas prices are skyrocketing upwards each day compared with the day before.

Not only has gas price stayed extremely stable for us, but we haven't been driving as much because of the supposedly inflated pricing. So, we are spending LESS on gas, not more.

Our gasoline prices around The Woodlands area jump around a bit, based on the crude futures pricing.

That $2.79 IS at an Exxon station. At Costco right now it is $2.65/gallon ($2.99 for 93 octane) one mile from my house. And, just curious, why are you putting 93 octane in the Toyota? I believe it is configured to run on 87 octane?
 
Has your gas price gone up at all in the past month? Ours hasn't. And yet, according to mass media, we should be freaking out at how gas prices are skyrocketing upwards each day compared with the day before.

Not only has gas price stayed extremely stable for us, but we haven't been driving as much because of the supposedly inflated pricing. So, we are spending LESS on gas, not more.
Our gasoline prices around The Woodlands area jump around a bit, based on the crude futures pricing.

So, you don't know? OK, that's fine, and believe me, I get it. At some time you might enjoy trying to get a rough idea of how much your local gas prices are responding to skyrocketing inflation, if at all. Of course, as you point out, inflation is not the only factor influencing gas prices, no matter what your location. I think that the idea that we are all in a state of panic mainly due to rising gas prices is not very realistic. At least, not here.
 
Regular gas, aka horse p***, is $3.29/gal at a Costco near me. I don't know what premium costs.
 
So, you don't know? OK, that's fine, and believe me, I get it. At some time you might enjoy trying to get a rough idea of how much your local gas prices are responding to skyrocketing inflation, if at all. Of course, as you point out, inflation is not the only factor influencing gas prices, no matter what your location. I think that the idea that we are all in a state of panic mainly due to rising gas prices is not very realistic. At least, not here.

Yes, there is some inflation cost adder depending on retailer's costs.

The big factor in price "differences" in gasoline is state taxes. In states like California, users are paying very high gasoline prices due to their state governments adding taxes on. Another factor in gasoline pricing is fuels formulation. Some states, like Illinois and California use blends of gasoline that meet a higher standard for emissions. And there is some reformulation due to climate. This added processing adds to wholesale cost.

Then there are the crude and finished products futures pricing effects as I mentioned before.

All of these factors add into the retail price schemes where one lives.
 
Generally, the further away from Texas you are, the higher the gasoline retail price.

See this: https://www.gasbuddy.com/gaspricemap?lat=38.822395&lng=-96.591588&z=4


Anyway, I don't drive much these days, so gasoline price does not bother me much. And I don't buy much "stuff" either, so high inflation is of concern to me more for the general state of the economy rather than for personal finance reasons.
 
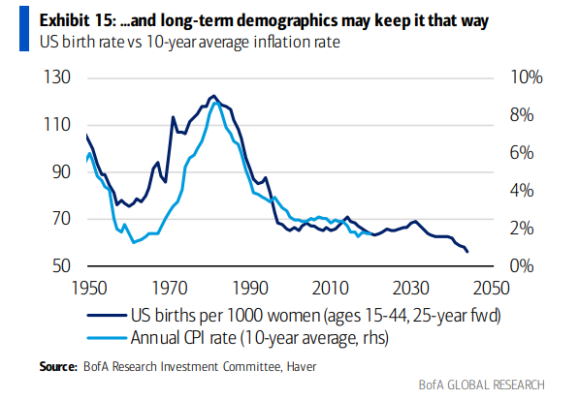
The 10 year bond is signaling a benign inflation environment. I expect that will be the case due to our demographics.
When I saw this chart I was reminded of your post
 

Attachments

  • 0F6C380F-5719-40B4-A839-931DEDB19138.png
    0F6C380F-5719-40B4-A839-931DEDB19138.png
    63.4 KB · Views: 14
^^^ Very interesting! How to explain this?

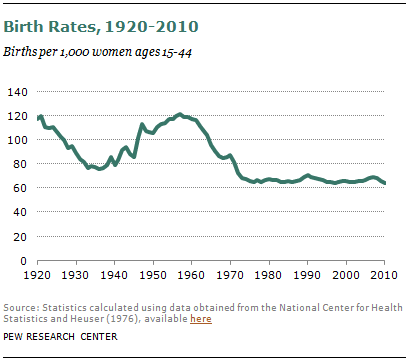
I saw the following birthrate chart on the Web, which does not quite agree with the above.

2012-us-birth-rate-00-04.png


PS. If you look closely, the two charts of birthrate are similar. However, the scales are way different. The BoA chart showing a peak in the birthrate at around 1982. However, the chart from Pew Research that I found shows that peak in 1958, and that corresponds to the Baby Boomer period.

Conclusion: the B of A chart has the wrong time scale for the birthrate plot! The time scale for the inflation plot appears to be correct. When the two plots are compared using the correct time scale, there is no correlation between birthrate and inflation.
 
Last edited:
^^^ Very interesting! How to explain this?

I saw the following birthrate chart on the Web, which does not quite agree with the above.

2012-us-birth-rate-00-04.png


PS. If you look closely, the two charts of birthrate are similar. However, the scales are way different. The BoA chart showing a peak in the birthrate at around 1982. However, the chart from Pew Research that I found shows that peak in 1958, and that corresponds to the Baby Boomer period.

Conclusion: the B of A chart has the wrong time scale for the birthrate plot! The time scale for the inflation plot appears to be correct. When the two plots are compared using the correct time scale, there is no correlation between birthrate and inflation.
Very interesting and nice catch if true. This will be the first time I've ever heard of anybody lying with figures.:LOL:
 
1. Interviewee on Bloomberg expects benign inflation next year. Overweight equities. Fully invested. Didn’t get the guest’s name, sorry. She is an investment company market analyst. I’m on board with these ideas.

2. Gasoline today is at the same price level as in 2019 in relation to average weekly earnings. Gas prices = back to normal.
 
^^^ Very interesting! How to explain this?

I saw the following birthrate chart on the Web, which does not quite agree with the above.

2012-us-birth-rate-00-04.png


PS. If you look closely, the two charts of birthrate are similar. However, the scales are way different. The BoA chart showing a peak in the birthrate at around 1982. However, the chart from Pew Research that I found shows that peak in 1958, and that corresponds to the Baby Boomer period.

Conclusion: the B of A chart has the wrong time scale for the birthrate plot! The time scale for the inflation plot appears to be correct. When the two plots are compared using the correct time scale, there is no correlation between birthrate and inflation.

I think you may want to read the legend to the BofA chart once again. It's the birthrate 25 years forward.

Which makes perfect sense I think.
 
1. Interviewee on Bloomberg expects benign inflation next year. Overweight equities. Fully invested. Didn’t get the guest’s name, sorry. She is an investment company market analyst. I’m on board with these ideas.

Really:confused: Here's some real data:

https://wolfstreet.com/2021/12/14/u...r-price-pipeline-inflation-rages-at-20-to-28/


Raging price pressures in the pipeline are heading for consumers

Even as consumer price inflation has spiked at the worst rate in 40 years, far-worse inflation rages further up the price pipeline as it’s flowing toward consumer prices. Going up the inflation pipeline of goods and services from the Consumer Price Index (CPI), we first get to the producer Price Index (PPI) for Final Demand, and further up the price pipeline, we get to the four stages of the PPI for Intermediate Demand.
 
Thanks for the data. And?

According to the article,if you read it, Wolf feels inflation in the service sectors will be bad next year and probably longer.

Plus, the point was made that, historically, even if the FED takes action to quell inflation, it takes a couple of painful years to make any progress in that direction due to momentum of price and commodity price increases.
 
I think you may want to read the legend to the BofA chart once again. It's the birthrate 25 years forward.

Which makes perfect sense I think.

OK. I stand corrected.

The BoA chart shows correlation between the birthrate vs the inflation roughly 25 years later. This means the Baby Boomer birthrate peaking at about 1956-1958 corresponds to the peak inflation 25 years later, at about 1980-1982.

Hmmm... Is this a real correlation, or a coincidence?

If inflation is caused by a lot of people hitting adult age and consuming more, then the high inflation in the 70s was not caused by the oil embargo and the Vietnam war as commonly believed.
 
Last edited:
OK, look at inflation over the decades. What is the average time in months from trough to peak back to trough?
 
OK. I stand corrected.

The BoA chart shows correlation between the birthrate vs the inflation roughly 25 years later. This means the Baby Boomer birthrate peaking at about 1956-1958 corresponds to the peak inflation 25 years later, at about 1980-1982.

Hmm... Is this a real correlation, or a coincidence?

If inflation is caused by a lot of people hitting adult age and consuming more, then the high inflation in the 70s was not caused by the oil embargo and the Vietnam war as commonly believed.

Correct. Bretton Woods had an effect which doesn't seem widely written about. Read some of Ray Dalio's posts on the "New World Order" or similar title.
 
OK. I stand corrected.

The BoA chart shows correlation between the birthrate vs the inflation roughly 25 years later. This means the Baby Boomer birthrate peaking at about 1956-1958 corresponds to the peak inflation 25 years later, at about 1980-1982.

Hmmm... Is this a real correlation, or a coincidence?

If inflation is caused by a lot of people hitting adult age and consuming more, then the high inflation in the 70s was not caused by the oil embargo and the Vietnam war as commonly believed.

It was caused by several factors, but surge in demand from baby boom was an important one.

And our slow population growth figures to keep inflation low once we work through supply constraints and pent-up demand for goods.
 
Back
Top Bottom