Inflation and new FRED info

Lsbcal

Give me a museum and I'll fill it. (Picasso) Give me a forum ...
Joined
May 28, 2006
Messages
8,811
Location
west coast, hi there!
I am posting this since many here are somewhat concerned about inflation. The Fed has come out with a set of new graphs showing various measures of expected inflation. Here is a link to the 35 charts in this series:

https://fred.stlouisfed.org/release?rid=500&utm_medium=email&utm_campaign=FRED%20Data%20News%201221&utm_content=FRED%20Data%20News%201221+CID_e44aa0c560fa4688d9b0e0b0bdce6c50&utm_source=Research%20newsletter&utm_term=35%20new%20series

For instance, the 2 year inflation expectations in the markets are shown here:
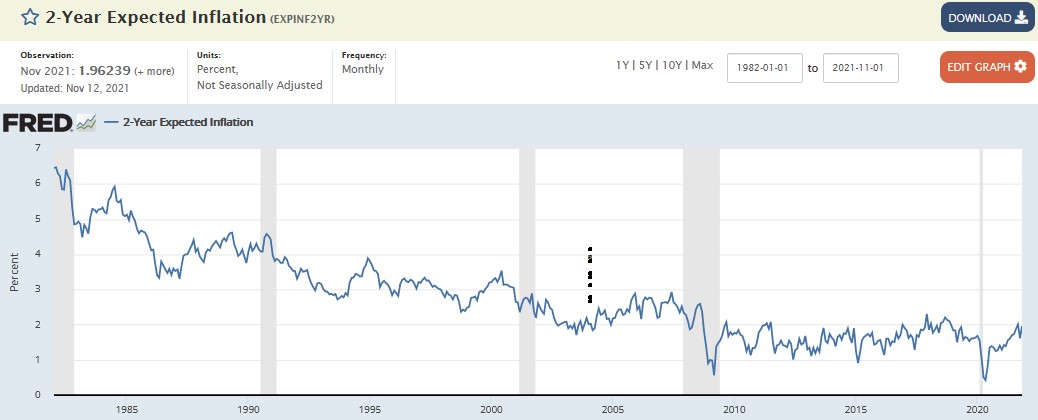
image1.jpg


I have not done it but would be interested to see something like the 2 year expected inflation together with the actual 2 year inflation in the same chart. Would be interesting to see how expectations anticipated reality.
 
I see 1 year expected inflation bouncing between 1.85% and 2.68% very recently. If the predictions aren't stable, they could change again soon.
https://fred.stlouisfed.org/series/EXPINF1YR

I value economist Mohammed Al-Erian's take, who correctly criticized the Fed for not dropping "transitory" from their description of inflation.
https://www.bloomberg.com/news/arti...d-should-recognize-inflation-isn-t-transitory

While he warns against a policy mistake, my guess is the Fed has already made the mistake. The Fed funds rate is 0% as they pump $1.5T into bond markets - they're already late. Next year I have two guesses that point to higher than expected inflation: guess 1, the Fed plays catch up and raises the Fed funds rate at least 3 times next year, surprising estimates of 1-2 rate increases. Guess #2, they do nothing and make it worse - consumers start to internalize inflation, and accelerate buying, which then fuels more inflation (too much demand).

I'm planning to invest a very small percentage in financials in the belief the 2.3% +/- 0.5% prediction is too low.
 
Last edited:
Considering how the Fed has been off the mark the past 6 months or so with its statements of inflation only being "transitory", I'm not really believing anything they have to say regarding their expectations for inflation. They're already wrong based on the previous statements.

I also do not listen to anything coming out of the St. Louis Fed, as it was a couple of their economists who authored a paper, maybe 2 years ago, that said there was no choice - the Fed needed to take rates negative.
 
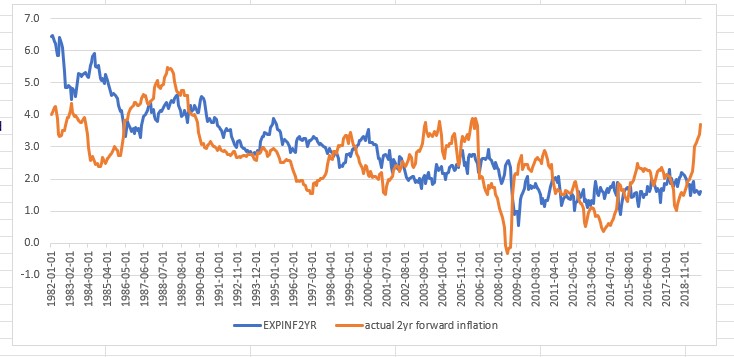
I tried to answer my own question mentioned in the OP. I took the expected inflation for the next 2 years and plotted it against the actual inflation as measured by the cpi for all urban consumers:


image1.jpg


It looks like the Fed model is not something to hang your hat on. But then, predicting the future is hard.
 
Who is new FRED?

Did something happen to old FRED? :D
 
+1 on FRED it’s a great resource we pay for by way of taxes.

+1 in the OP chart as a good indicator. Also look at 10/2 Treasury yield spreads. 0.7% recently.

Last, some experts are calling for 4% full year inflation in 2022. If inflation is running hotter than 4% now, which it is, it necessarily means that inflation will run quite a bit lower than 4% in the second half of next year.

Fear nothing.
 
There's always Fred's Intelligent Bear Site - "Exposing the FIBS they tell you about long term stock market performance." The site has long-term stock market graphs that take inflation into account. Fred's Intelligent Bear Site
 
We will know more in 2 days after next Fed meeting. I expect they will signal faster/more rate hikes than previously.

The 10 year bond is signaling a benign inflation environment. I expect that will be the case due to our demographics.
 
The 10 year bond is signaling a benign inflation environment. I expect that will be the case due to our demographics.

Yes, our demographics, and also global imbalances.
 
When I see inflation heat up, especially in gas prices, I remind myself that my equities have done pretty well during those times. Deflation is no fun. I've easily beat the gas prices in our portfolio.

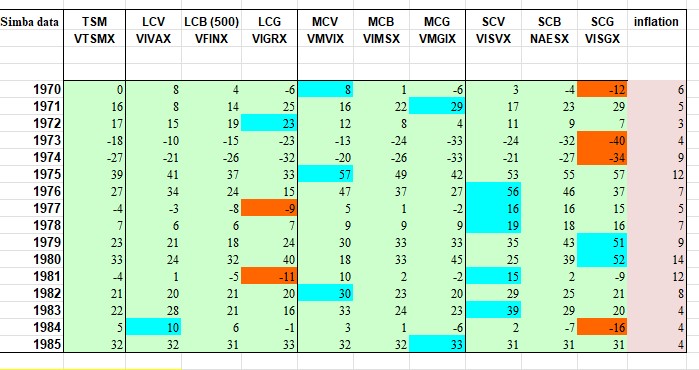
The inflation of the 1970's was very bad. Plus taxes were not indexed back then. Here is a table I did to convince myself that there were decent ways to keep your head above water:


image1.jpg


This shows large, midcap and small cap for value, blend, and growth. So LCV=large cap value stocks.

Clearly value stocks were best. I don't know but maybe some of this had to do with natural resource oriented plays like oil companies that were great investments after the oil shocks.
 
We will know more in 2 days after next Fed meeting. I expect they will signal faster/more rate hikes than previously.

The 10 year bond is signaling a benign inflation environment. I expect that will be the case due to our demographics.

How can anything signal anything when the FED is presently buying 105 Billion in bonds per month? Would the signal be somewhat different if the FED were selling 105 Billion in bonds per month in addition to the US government issuance?
 
When I see inflation heat up, especially in gas prices, I remind myself that my equities have done pretty well during those times. Deflation is no fun. I've easily beat the gas prices in our portfolio.

The inflation of the 1970's was very bad. Plus taxes were not indexed back then. Here is a table I did to convince myself that there were decent ways to keep your head above water:


image1.jpg


This shows large, midcap and small cap for value, blend, and growth. So LCV=large cap value stocks.

Clearly value stocks were best. I don't know but maybe some of this had to do with natural resource oriented plays like oil companies that were great investments after the oil shocks.

Does your view of the 1970s change if bond yields and interest (CD) rates are also included in the discussion? Investors had good choices in the late 70s-early 80s. As we do today, lots of good choices.
 
Does your view of the 1970s change if bond yields and interest (CD) rates are also included in the discussion? Investors had good choices in the late 70s-early 80s. As we do today, lots of good choices.

Not quite sure what you mean by "good choices". In the late 70s I imagine that real yields were basically negative then. After all inflation was increasing and bond yields were increasing making old bonds a terrible investment. In the early 80s bonds were a good investment as rates start irregularly declining leading so nice cap gains. But I think most investors in 1982 when rates peaked were looking in the rear view mirror and dreading the future.

I was just looking at stock funds and investing in a newish thing called no-load stock funds (as opposed to load funds). I had a subscription to an investment newsletter and tried to make sense of the funds then available. Most no load funds you had to buy via the mail. A few had some telephone options like switching out of them. Index investing was really not available and ER's were fairly high. Nothing like the possibilities today.

FWIW, I was too young back then to have much money to invest. We bought a house in Silicon Valley in 1975 and that did well. It was generally recognized by 1974 that inflation was an ongoing problem. I did not know much about bonds and our money was at Vanguard in something new back then called a money market account.
 
Last edited:
On November 10th (about a month ago), I wrote:
I think inflation is an endlessly fascinating topic to discuss.

Today I got gasoline for the Venza. Well, Frank got it, that is, I was just along for the ride since I have not yet started driving again after my illness.

Anyway, I thought it was hilarious that premium gas was $3.99/gallon!!!

A month later, on December 11th, I filled up with the same gas at that same gas station. The price was still $3.99/gallon. Pretty good. Seems like gas prices are settling down.

Oh, and this time I drove my car to the gas station to get it and pumped the gas myself. :D Hard to believe that I am already feeling so much better.
 
How can anything signal anything when the FED is presently buying 105 Billion in bonds per month? Would the signal be somewhat different if the FED were selling 105 Billion in bonds per month in addition to the US government issuance?

As I understand its
$80b of Treasuries, $40b of MBS, but it's a fair point. Yet prices still move and react to news. They were sharply lower last year and rose as the economy improved in Aug of last year. Just what you would expect.
And certainly those purchases reduce rates-they are supposed to do that after all.

But...

1. If the Non-Fed purchasers thought 1.41 percent was a ridiculous rate bound to lose money, why would there be ANY buyers besides the FED?

2. In light of steady FED purchases all year, why is the 10 year rate not now at its highest level of the year? It peaked in March/April.

3.Why has the 10 year rate actually declined since the latest taper talk began recently?
 
Last edited:
As I understand its
$80b of Treasuries, $40b of MBS, but it's a fair point. Yet prices still move and react to news. They were sharply lower last year and rose as the economy improved in Aug of last year. Just what you would expect.
And certainly those purchases reduce rates-they are supposed to do that after all.

But...

1. If the Non-Fed purchasers thought 1.41 percent was a ridiculous rate bound to lose money, why would there be ANY buyers besides the FED?

2. In light of steady FED purchases all year, why is the 10 year rate not now at its highest level of the year? It peaked in March/April.

3.Why has the 10 year rate actually declined since the latest taper talk began recently?

The other major purchaser of debt is Foreign Central Banks and state and local government pension funds. Of the 1.5 trillion of new debt issued in 2021 FED bought effectively 100% of it.
 
Dang. PPI @ 9.9% YoY. That's gonna flow into the CPI next year.
 
When I see inflation heat up, especially in gas prices, I remind myself that my equities have done pretty well during those times. Deflation is no fun. I've easily beat the gas prices in our portfolio.

The inflation of the 1970's was very bad. Plus taxes were not indexed back then. Here is a table I did to convince myself that there were decent ways to keep your head above water:


image1.jpg


This shows large, midcap and small cap for value, blend, and growth. So LCV=large cap value stocks.

Clearly value stocks were best. I don't know but maybe some of this had to do with natural resource oriented plays like oil companies that were great investments after the oil shocks.


Low P/E stocks have shown signs of beating high P/E growth stocks in the recent days. This is most easily seen by contrasting the chart of Tesla, Nvidia, and the likes against the lower P/E defensive consumer staples stocks such as Procter Gamble, Coca Cola, and the pharmaceuticals.

The above is not surprising. What I don't understand is that the above split between the two groups took so long to develop. Perhaps people did not want to believe that higher inflation and the ensuing policy change would impact their beloved growth stocks, and it took some time for the news to soak in.

Here is the raw data. I include it here in case you or others want to analyze cause/effect relationships. It was taken from the Bogleheads "Simba" data set:


image1.jpg


I recall that a few mutual funds (like Pennsylvania Mutual) that did well after the 1974-75 recession with small cap funds. It is interesting to me that small and midcap value have been laggards although they perked up in the first half of this year. Perhaps growth to small value is not far off?
 
On November 10th (about a month ago), I wrote:

A month later, on December 11th, I filled up with the same gas at that same gas station. The price was still $3.99/gallon. Pretty good. Seems like gas prices are settling down.

Oh, and this time I drove my car to the gas station to get it and pumped the gas myself. :D Hard to believe that I am already feeling so much better.

Wow! $3.99 gallon! Just a few miles west of you in the Great State of Texas, we are paying $2.79 a gallon (87 octane).
 
Wow! $3.99 gallon! Just a few miles west of you in the Great State of Texas, we are paying $2.79 a gallon (87 octane).

Well, that's not for horse p*** regular at a convenience store or anything like that. It was for the highest (premium, 93 octane?) grade of Exxon gasoline, at a convenient Exxon in an urban location. It's the gas station I am used to going to, since it's close to my home. The point you were supposed to get from my post was not that my gas station offers a huge bargain, but that the gas price didn't budge by even one cent a month later. Apparently I wasn't too clear. :)

Has your gas price gone up at all in the past month? Ours hasn't. And yet, according to mass media, we should be freaking out at how gas prices are skyrocketing upwards each day compared with the day before.

Not only has gas price stayed extremely stable for us, but we haven't been driving as much because of the supposedly inflated pricing. So, we are spending LESS on gas, not more.
 
The other major purchaser of debt is Foreign Central Banks and state and local government pension funds. Of the 1.5 trillion of new debt issued in 2021 FED bought effectively 100% of it.

Any thoughts on rates flat/declining in face of taper talk?
 
Back
Top Bottom