Why I have a portion of long term bonds

That is not bad. There is no point in having two correlated assets. Anti-correlated is best; uncorrelated is OK.

Actually lots of people use correlated assets. A typical stock portion of a portfolio that many people use is an SP500 index fund and "tilt" it with SCV to improve returns while maintaining the same long-term volatility. And the SP500 and SCV are positively correlated (the correlation just isn't 1.0). Same with bonds of different duration.
 
...
However, over the entire timeframe of stocks and bonds, you'll see that both Intermediate govt bonds and Long Term government bonds are actually uncorrelated to stocks, not anti-correlated. The simba spreadsheet also has a nice correlation table for 1972-2014 by the way. If you go back to 1926 you'll see that the uncorrelated nature of stocks to govt bonds (both long term and intermediate) still holds over that timeframe (that data is available in Ibbotson's annual yearbook available at most university libraries) Now that doesn't mean that there won't be periods of time within the 1926-2014 timeframe where they're correlated or anti-correlated. You'll notice that LTBs did phenomenally well in 2008 against stocks. In the 2000-2002 bear market they did well for 2 of those 3 years but not for all 3 years. But if you go back to the bear market of the early 1970's you'll see they didn't do as well as the more recent bear markets. Why is that? Was it inflation? Was it where the interest rates were back then vs more recently? I'm not sure and that's something on my to-do list to look at.
...

Big-Papa
I've looked back to the 1954 period using Fed data. The 5yr Treasury took a hit then as rates moved up. For about 5 years the rates rose pretty fast and one would have gotten low real returns. Those rates in 1954 were only slightly higher then today's rates. I have not done the same analysis for LTB as I've never considered them for my portfolio. A guess would be that they would perform pretty poorly for the first part of that rate rise starting in 1954.

Mid cap value seems to be a sweet spot from my data for MSCI indexes and VG funds since about 1992. One reason might be MV retains the value premium but does not have the negative small cap premium of large value. That would be a factor analysis person's explanation.
 
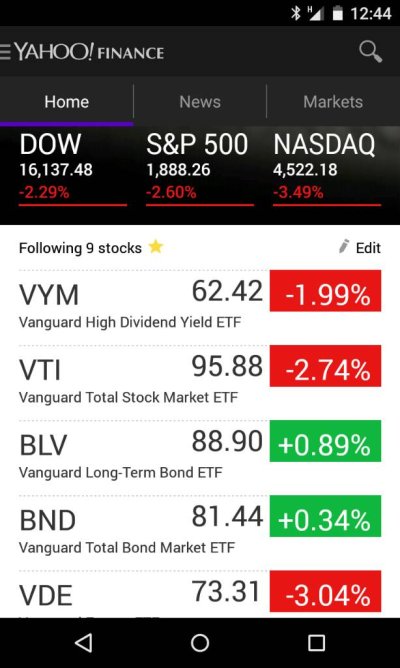
Unfortunately, what we have been seeing since the 4th of January is starting to look like a textbook example of anticorrelation of long term bonds against stocks. S&P has gone from 2043 to 1888 or about 7.6% down for the year. BLV has gone from 86.81 up to 88.90 or an increase of 2.4%. See below for the trend continuing.

Sent from my Nexus 4 using Early Retirement Forum mobile app
 

Attachments

  • 1452714984571.jpg
    1452714984571.jpg
    69.2 KB · Views: 16
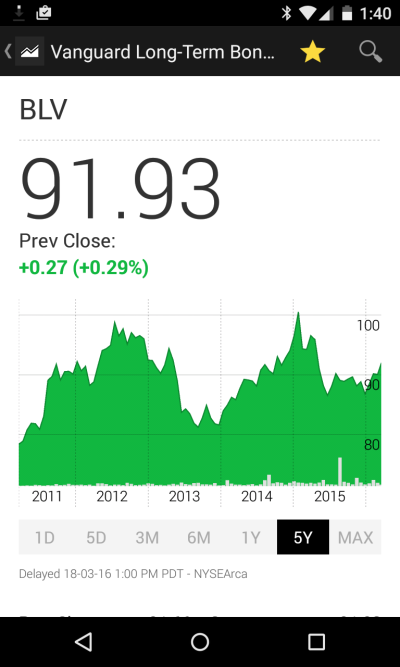
BLV back in the green for us

BLV was the ETF that I have been using for long term bonds. I pointed out earlier that I kind of believe that due to the malaise in our economy, I expect interest rates to not really change significantly going forward. Well, this investment that my family has made in this particular ETF of about $270k is in the positive by about $7K overall, not including dividends. Plus it has been earning about 4.1% the whole time. It is about 40% of our bonds.

The combined interest rate for our family's bonds is 40%*4.1+60%*2.3 or about 3% overall. This was our goal, not to get too greedy, but to have "enough" to get the job done as Bogle would say it.

Overall, including stocks, 6% is the expected return. 10% stocks + 3% bonds.

Sleeping well at night... :)
 

Attachments

  • BLV Screenshot_2016-03-19-13-40-39.png
    BLV Screenshot_2016-03-19-13-40-39.png
    103.1 KB · Views: 18
Why not just focus on total return? The addition of an asset should increase total return, no? Or at least lower standard deviation without decreasing return much.
I believe the graphs in my post #39 do reflect total return and it is superior to that of Wellesley (my current standard for total return and volatility) with less volatility (see 5th graph). If I am wrong, please advise.

I should point out that both assets show good total returns over time. I do not consider assets that do not grow well over time even if they are uncorrelated. Cash is uncorrelated with everything but I use it only to park my money, not as part of an AA program.
 
Last edited:
The Simba spreadsheet has a tab that shows the source of the returns it uses. It actually has two tabs for two different timeframes. It uses Vanguard funds when they existed, before then they are derived from indices or research.

OK, I once went this same route for a while (SCV + LTB) for exactly the same reason you did. You have two asset classes with large returns. And everybody knows that stocks/bonds are a good mix.

However, over the entire timeframe of stocks and bonds, you'll see that both Intermediate govt bonds and Long Term government bonds are actually uncorrelated to stocks, not anti-correlated. The simba spreadsheet also has a nice correlation table for 1972-2014 by the way. If you go back to 1926 you'll see that the uncorrelated nature of stocks to govt bonds (both long term and intermediate) still holds over that timeframe (that data is available in Ibbotson's annual yearbook available at most university libraries) Now that doesn't mean that there won't be periods of time within the 1926-2014 timeframe where they're correlated or anti-correlated. You'll notice that LTBs did phenomenally well in 2008 against stocks. In the 2000-2002 bear market they did well for 2 of those 3 years but not for all 3 years. But if you go back to the bear market of the early 1970's you'll see they didn't do as well as the more recent bear markets. Why is that? Was it inflation? Was it where the interest rates were back then vs more recently? I'm not sure and that's something on my to-do list to look at.

But make a note that the bigger anti-correlation during big downturns (and the subsequent big recovery year) is a more recent phenomenon - not guaranteed to always be the case.

Big-Papa
thanks, Big-Papa. I will look into this. You directed me to Simba's spreadsheet which took me in this direction.
 
Bonds are a subtle investment. Everyone seems to be aware of the rough estimate of how much long term bonds can go up or down. You simply multiply the change in interest rate times the duration and the result is the amount of gain or loss. BLV has a 15 year duration, so if it's interest rate changes by 1% it can change value by 15%, a seemingly scary figure. The subtle part is that it already is somewhat closer to historical rates and so I think will see somewhat smaller interest rate changes. Plus it earns 4.1% instead of 2.3% BND return, a 5 year duration bond. Both are solid bonds with high % treasuries and no junk. I use about a third long term and two thirds medium term bonds. I'll let you all know in a few years if this was a good move or a bad move.
FYI, TLT has more bounce (volatility) to it than BLV:PerfCharts - StockCharts.com - Free Charts
right-click on the '200 days' bar and set it to 'ALL' and see the available histories of both together (total return).

I have not committed to my proposed plan yet,but if and when, I too will let y'all know if it was a good move or a bad one.
 
Actually lots of people use correlated assets. A typical stock portion of a portfolio that many people use is an SP500 index fund and "tilt" it with SCV to improve returns while maintaining the same long-term volatility. And the SP500 and SCV are positively correlated (the correlation just isn't 1.0). Same with bonds of different duration.
All true. Still, over time, there is a relative premium to SCV vs. large cap (S&P500). Here is Wellesley vs VFINX vs SCV:
PerfCharts - StockCharts.com - Free Charts
Why choose S&P500 (VFINX) when you can get better long-term performance and less volatility with Wellesley? And if a combo of LTB and SCV outperforms Wellesley with less volatility than Wellesley over long periods of time, why not go 50/50 SCV/LTB instead?

As we are in IMHO uncharted territory, I have not committed to this path yet but it remains compelling. As always, comments welcome.
 
One of my goals for long term bonds was to use UNcorrelated assets in mixing it up with stocks. This lowers volatility

Sent from my Nexus 4 using Early Retirement Forum mobile app
 
When I started this thread several months ago, I had no idea that interest rates would decline and that this asset, BLV, would grow from $87.55 to $95.00 a share plus be paying dividends at a rate of about 4%. But that was the whole point, wasn't it?... To have a portion of one's investments in a truly diversifying asset of reasonable risk.

That was an increase of over 8% + the 4% dividends.

I would not recommend buying BLV today because it has become over valued now, but I have no plans to sell it either.


Sent from my iPhone using Early Retirement Forum
 
I'm not surprised that interest rates have dropped (again!), and long bonds appreciated the most.

But, personally, I prefer intermediate bonds because they are less volatile and catch up with inflation faster. I'm inclined to believe there is a much reduced chance of deflation in the next few years.

The longest position I have is now down to 6.2 years average maturity, the FTABX municipal bond fund. I think it used to be 7 years or more. Most of my bond funds are 5 or under.

Munis have done quite well over the past couple of years. I've found they add nice diversification to my other bond holdings.
 
For those not versed in history (and I wasnt with this specific info, myself) with bond market manipulation still in force world wide, dont assume any inflation will cure the low interest rate cycle....Yes inflation can climb significantly higher and treasuries stay very low.
As a writer from Seeking Alpha "South Gent" (my favorite writer) wrote below.....
Also, the period from 1941 to 1951 is very instructive on how the FED can manipulate rates down even as inflation soars. The problem is that this approach launched a 32 year bear market cycle in bonds. That bear started with what I call a rate normalization process after the FED ceased its intervention in the market's rate setting.

CPI Annual Rates:

1941 5.1%
1942 10.9%
1943 6.0%
1944 1.6%
1945 2.3%
1946 8.5%
1947 14.4%
1948 7.7%
1949 -1.0%
1950: 1.1%
1951 7.9%

Ten Year Treasury Rates

Jan 1, 1952 2.68%
Jan 1, 1951. 2.57%
Jan 1, 1950 2.32%
Jan 1, 1949 2.31%
Jan 1, 1948 2.44%
Jan 1, 1947 2.25%
Jan 1, 1946. 2.19%
Jan 1, 1945. 2.37%
Jan 1, 1944. 2.48%
Jan 1, 1943. 2.47%
Jan 1, 1942. 2.46%
Jan 1, 1941 1.95%


Sent from my iPad using Tapatalk
 
Last edited:
A 32 year bear market in bonds was related to the long period of inflation that began to end in 1982 with the very high interest rates put in place then. This was a little like putting the whole economy into a recession just to cure inflation.

I would be quite impressed if a similar inflation reoccurred today. More likely we'll experience a long period of tepid growth with an extended period of low interest rates, not that I can predict the future or anything. I'm just hedging my investments with this tepid growth in mind. I'll be pleasantly surprised if it turns out to be better than this.


Sent from my iPhone using Early Retirement Forum
 
Back
Top Bottom