RunningBum
Give me a museum and I'll fill it. (Picasso) Give me a forum ...
- Joined
- Jun 18, 2007
- Messages
- 13,249
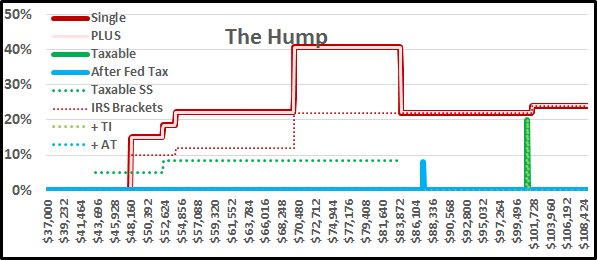
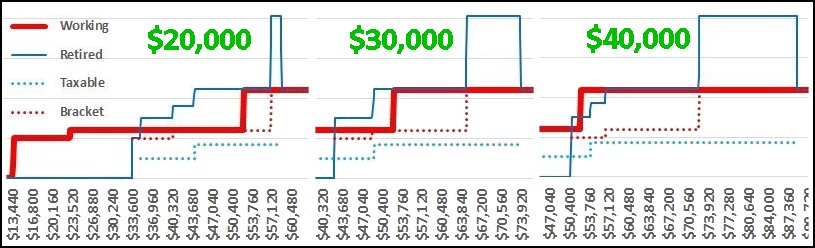
I understand the concept of the SS hump.
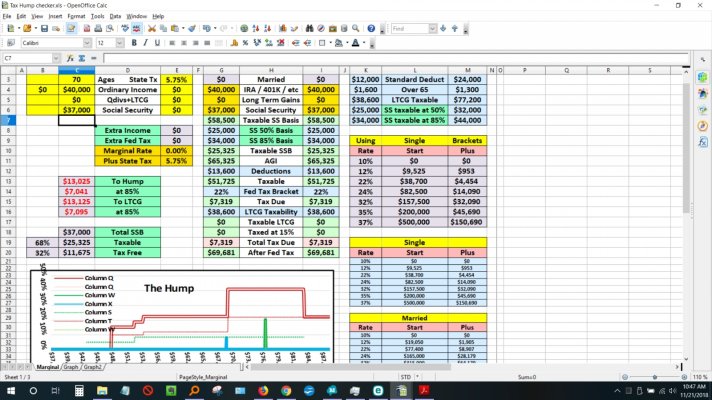
I have a lot of trouble figuring out the spreadsheet. I suspect it's the same problem anyone would have with mine. I know my own, but it's not too clear for others how to use. I guess some of you have figured it out. I'm not collecting SS yet so I haven't tried too hard. I look at that graph and see Column Q, Column W, etc, and I don't follow what those represent.
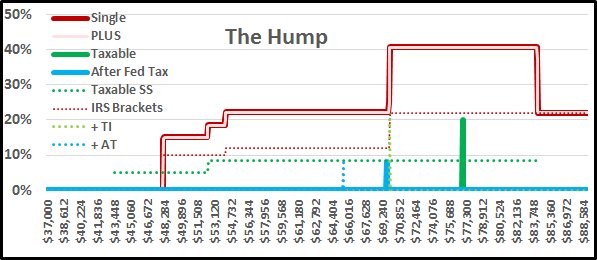
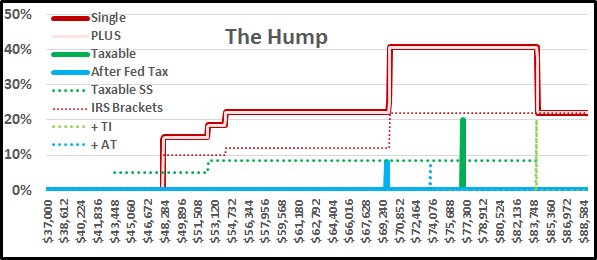
Isn't it kind of late to be looking at the SS hump once you are collecting SS and taking RMDs? It seems there isn't much left to do at this point. Isn't the real message that you should do what you can in the years before, like try to convert your tIRA to a Roth so you don't have RMDs? I see people say, if it's going to be 22% now or 22% later, why convert now, but this exercise helps show that there will be a hump above 22% for many people, which favors conversion.
I have a lot of trouble figuring out the spreadsheet. I suspect it's the same problem anyone would have with mine. I know my own, but it's not too clear for others how to use. I guess some of you have figured it out. I'm not collecting SS yet so I haven't tried too hard. I look at that graph and see Column Q, Column W, etc, and I don't follow what those represent.
Isn't it kind of late to be looking at the SS hump once you are collecting SS and taking RMDs? It seems there isn't much left to do at this point. Isn't the real message that you should do what you can in the years before, like try to convert your tIRA to a Roth so you don't have RMDs? I see people say, if it's going to be 22% now or 22% later, why convert now, but this exercise helps show that there will be a hump above 22% for many people, which favors conversion.