Overconfidence In Market?

Reading through a thread such as this brings out the variety of opinions and ideas that are out there. Sifting through the responses, if one doesn't have a closed mind, will allow the reader to eventually come to the right answer for her/him. Not everyone's opinion is equally valid (although most here respect the right of the individual to hold it, but maybe not expouse it here), especially if it is based on extreme bias, misinformation, or misunderstanding. That's why I love the historical analyses that people here throw out. They help us see past today, and tomorrow. A myopic lot, are we humans, generally! Anyway, good thread, even though it was a bit frustrating at time!
 
At £20,000 or so it's cheaper than a used RV.
So cheap you can't afford to NOT buy one!

https://tanks-alot.co.uk/product/chieftain-tank/

I don't know a whole lot about tanks, but the photo that HFWR posted is that of an M1 in mint condition while when I look at your link above I only see what can be described as, er, rust buckets.

Sorry, but I will pass.

PS. I found that the M1 tank cost $9M a piece in 2016, according to Wikipedia.
 
I’ve been 100% in the market (mutual funds only) since 1985. I was on military deployment during the black Monday of 1987 so I didn’t have the opportunity to over react. By the Time of the big crash in 2008 I was „seasoned“ (or numb!) to the rollercoaster that is the market. I‘m retired now and am still 100% in the market. It’s not for everyone but it has worked for me and allowed me to retire at 44 years old, get bored-go back to work, then retire again at 50. I‘m finding withdrawals to be way more nerve wracking than investing ever was!
 
Overconfidence in the market does not have to do with what the success or failure of any single market strategy will do. It is a statement of the collective mind of the group of investors in the market. Apollo Creed was overconfident against Rocky Balboa and still won the fight.

If one cannot objectively look at this thread and realize that as a group investors are overconfident, I am surprised. Of the 13 largest IPO’s in the last 3 quarters only 2 had a profit in their history and over 6 had the qualifier that they might never make a profit. Yet their net IPO issuance was nearly 200 billion dollars.

This can only happen when the market as a whole is highly confident in the future for growth of stocks, yet it does not effect the ultimate performance of the companies which each have their individual leadership and paths to take.
 
This is an interesting thread - some good thoughts and I learned some things.

That said, I still think we were/are still being trolled.....
 
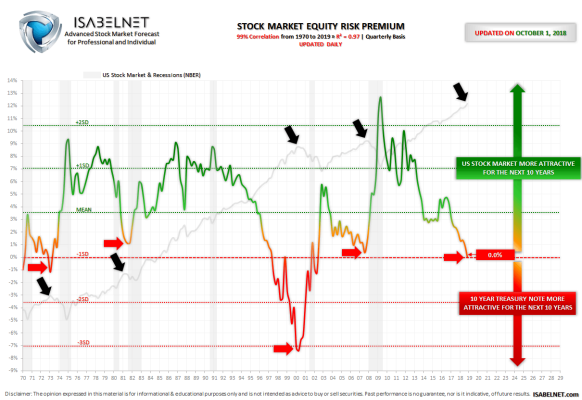
Interesting chart.
 

Attachments

  • 91FF4051-EC9B-41CD-B119-40339E0D7C7A.png
    91FF4051-EC9B-41CD-B119-40339E0D7C7A.png
    90 KB · Views: 77
I just re-read the first five pages of this thread, but not 6-8, so apologies if someone already covered this.

There was a lot of talk about the 90% drop in stocks between 1929 - 1932. What I didn't see was much if any talk of:

1937: The US stock market, which had been in an exuberant run since the low of 1932, plummeted again by about 50%, just in time to destroy the confidence of many who had bought in over the previous few years.

Japan: The NEIKKEI index peaked in 1989, a full three decades ago. The Simpsons had not yet launched Season 1, and George H. W. Bush (the elder) was the new president of the U.S. Today, in nominal terms, the NEIKKEI trades at roughly half the value it did at the peak. The Bank of Japan and Japan's government have embarked on nearly endless version of quantitative easing and "stimulus" but alas, their stocks simply don't go up for decades. It seems their citizens have lost faith in the market and would prefer non-yielding bonds to a stock market that never seems to escape the doldrums.

Personally, I'm in the camp of seriously reducing equity exposure at this point in a long and fantastic bull run. We're all super confident when things are going well. But even for those of us who stay the course during bad times, I think it's more a question of whether you're sleeping well at night with your asset allocation as opposed to feeling miserable. During the 2008 - 2009 time frame, I went pretty much all-in to the US stock market, but it was stomach-churning at the time. Now that effort has paid off, but I doubt I'll be nearly as aggressive even if we get the 50% peak to trough stock drop that I personally expect.
 
I just re-read the first five pages of this thread, but not 6-8, so apologies if someone already covered this.

There was a lot of talk about the 90% drop in stocks between 1929 - 1932. What I didn't see was much if any talk of:

1937: The US stock market, which had been in an exuberant run since the low of 1932, plummeted again by about 50%, just in time to destroy the confidence of many who had bought in over the previous few years.
Not to convince anyone one way or another, but the market had recovered about 4fold since the 1932 low, I think, so that 50% hit in 1937 still put it at about 2x the 1932 low. Just pointing out that it's not like it took a 90% hit from 1929-1932 and dropped an additional 50% below that in 1937. There was a big recover in the 5 years in between.

Japan: The NEIKKEI index peaked in 1989, a full three decades ago. The Simpsons had not yet launched Season 1, and George H. W. Bush (the elder) was the new president of the U.S. Today, in nominal terms, the NEIKKEI trades at roughly half the value it did at the peak. The Bank of Japan and Japan's government have embarked on nearly endless version of quantitative easing and "stimulus" but alas, their stocks simply don't go up for decades. It seems their citizens have lost faith in the market and would prefer non-yielding bonds to a stock market that never seems to escape the doldrums.
The Japan story for the last 30 years does worry me more. It's still a current day situation. I wonder why there isn't more talk about that here.
 
I'm in the camp of "getting nervous" of this market and have increased my bond allocation to close to 34% (from 22%). In addition approx. 20% of my equity is in utility stocks which hold up a bit better in major downturns.
 
Not to convince anyone one way or another, but the market had recovered about 4fold since the 1932 low, I think, so that 50% hit in 1937 still put it at about 2x the 1932 low. Just pointing out that it's not like it took a 90% hit from 1929-1932 and dropped an additional 50% below that in 1937. There was a big recover in the 5 years in between.

IMHO the 1937 hit was huge. It undermined much of what was assumed to be a recovery from a disaster. It took a world war and unbelievable misery to recover.
Anyway 2x nearly nothing was still paltry, and to take a 50% hit was the final straw for some people. Family history, so this is only anecdotal. Thanks
I understand. And I believe the confidence factor, though that's hard to enumerate and I still like to think I'd hold tight. I just wanted to make sure people understood numbers-wise that it didn't go another 50% below 1932, in fact it was still 2x higher, paltry or not.
 
Last edited:
I'm in the camp of "getting nervous" of this market and have increased my bond allocation to close to 34% (from 22%). In addition approx. 20% of my equity is in utility stocks which hold up a bit better in major downturns.
I haven't changed my AA strategy but I saw that I'm about 3.7% over balanced on equities, and I just brought that back inline to get back to my target of 63% equities, 37% bonds+cash.
 
http://www.early-retirement.org/forums/attachment.php?attachmentid=31600&d=1558617668

What is this R Squared value of 0.97? :confused: I think it represents something that the chart does not portray.:ermm:

It's the square of the correlation coefficient, aka coefficient of determination. You're told that the correlation is 99% (so the correlation coefficient is ~0.99), the square is 0.97. The following explains it:

What is the difference between coefficient of determination, and coefficient of correlation?
 
Yep. So looking at a chart with with a R Squared of over 0.90 says it is a good predictor (or good correlation). What the main point of this chart, and why does it have a 0.97 R Squared on it? :blink:
 
Not to convince anyone one way or another, but the market had recovered about 4fold since the 1932 low, I think, so that 50% hit in 1937 still put it at about 2x the 1932 low.

That is correct. But then there was a dead decade from around 1937 - 1946, give or take. To me, that eerily rhymes with today....we're up 4x since the 2009 low, and I've seen credible commentaries about how valuations have us in store for a completely flat decade. (Yeah, I know....no one knows for sure, but items like CAPE, MAPE, Market Cap to GDP, etc. have some reasonable predictive power over longer periods of time.)
 
Not to convince anyone one way or another, but the market had recovered about 4fold since the 1932 low, I think, so that 50% hit in 1937 still put it at about 2x the 1932 low.

There was a big recover in the 5 years in between.

IMHO the 1937 hit was huge. It undermined much of what was assumed to be a recovery from a disaster. It took a world war and unbelievable misery to recover.

IIRC, the gov't felt that the Depression was over around 1934 and started raising taxes which then apparently set off another bad downturn around '36. Not sure of the exact timing but I seem to remember reading something about that.
 
Phew - long and interesting conversation! As usual with threads of this type, I have little of substance to contribute. However, I have noticed recently that when watching Hulu, there are a lot of ads along the lines of "You too can live a life of leisure, flying in your own private jet and hanging out at ski resorts, by taking my course on how to trade stocks". My own terribly unscientific interpretation of this is that we have another year or two of this nuttiness, before it all ends in tears.

I'm also seeing ads plugging courses on how to flip houses. Not all RE markets have been soaring to new, dizzy heights, of course. However, I believe that many large metro areas have, including my home, the SF Bay Area.
 
Phew - long and interesting conversation! As usual with threads of this type, I have little of substance to contribute. However, I have noticed recently that when watching Hulu, there are a lot of ads along the lines of "You too can live a life of leisure, flying in your own private jet and hanging out at ski resorts, by taking my course on how to trade stocks". My own terribly unscientific interpretation of this is that we have another year or two of this nuttiness, before it all ends in tears...

Another year or two? I will take it.

I need another chance to raise my cash level. :)
 
I think that folks who have been in this game long enough to see some ups ad downs have the knowledge and background to make their own decisions. Some of us have had very high equity positions for the past 15 years, and it has served us very well. Others have a more conservative position, and they 'sleep well at night'. The folks that I would have a concern about are the young folks who have only experienced this big bull ride in the last 10 years. Maybe they have been in the market 15 years, and are interpolating that they can retire for the next 60 years based on what they believe to be a conservative 15% per year market performance.

I have been 95% equities for many years, and have greatly benefited from that allocation. I switched a bunch to a guaranteed interest fund two weeks ago, and moved a big chunk yesterday as well. Now riding 55% equities, 45% fixed. That is probably lower than I want to be in equities, but it was convenient to simply move 100% of my one S&P fund. I had asked the question about how to unwind a high equity position without market timing, but have concluded that sometimes you just have to rip off the band-aid.

My move from equities should lock in another move to the upside! Hopefully equities will surge another 20% and make me look like an idiot!
 
My move from equities should lock in another move to the upside! Hopefully equities will surge another 20% and make me look like an idiot!
I switched to 55/45 about 10 years ago and have been feeling like an idiot? :blush:
 
Back
Top Bottom