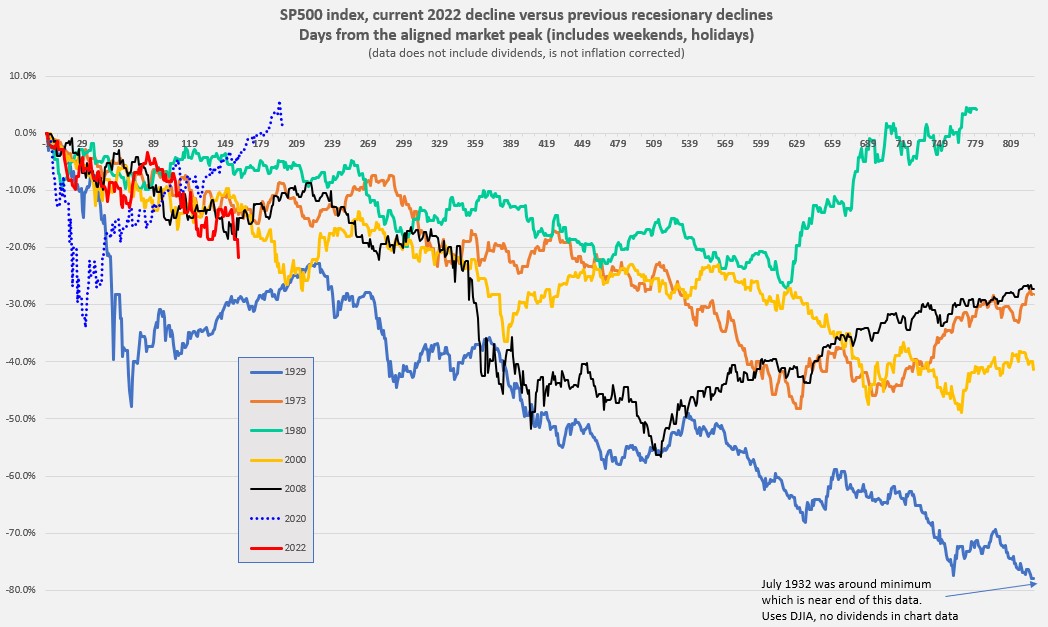
The numbers in my chart for the 1930's extend from September 1929 to July 1932. So yes, there was deflation for sure and maybe something like 20%. So maybe the market was down "only" 50% by July 1932 (bottom of the decline) when one considers deflation and dividends.
Still the message in this chart is primarily how long it takes to decline and how variable the decline would be. Plenty of sleepless nights if you were not set in your risk tolerance. And in the 1930's you'd be seeing a lot of unemployment (maybe even your job) and scary headlines. In today's hyper news environment it could be quite disturbing.
Okie granddad (Southern Oklahoma) told me that a)few people had jobs, b) the Dustbowl meant that the self-employed farmers didn't have income, c) prices went down but no-one had any cash money. He, grandma and my 3 year old dad lived in a converted chicken coop for a couple years before he worked for the CCC and felt fairly lucky they weren't starving.
")