Real learning took place outside of class.
This explains why my students were eager to get back to campus, but didn’t actually show up to class.
Real learning took place outside of class.
... I do not think this will be worse than my Okie grandfather's Great Depression, however, although he didn't own stock, he was picking cotton. As a final perhaps controversial thought, I also do not think repricing PEs to the norm is necessarily a bad thing--unless you and I compare our current portfolios to 6 months ago. It in fact might be a good thing, although markets in the past have a sad tendency to swing below normal PEs (gasp!)
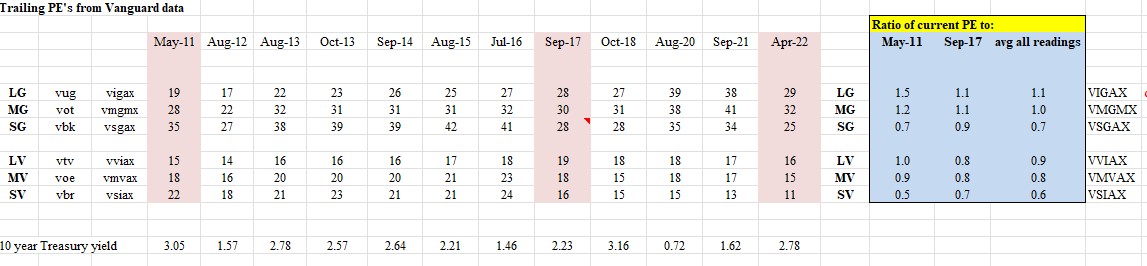
Regarding PE's, I occasionally record the PE's for various Vanguard asset class indexes:
The excessive PE's of the growth stocks have come down quite a bit. The value stock PE's are very low.
I’ve seen a lot of data saying the market is back to fair value, but that is IF earnings remain stable. The market can also overshoot fair value or earnings could drop. So there’s that.
So how many of these posts include the effects of dividends?
Especially when you're talking about recovery back to a certain level, you need to include the effect of dividends payments.
E.g. the 1929 crash didn't take nearly as long to get back to even as most think just looking at price level given the higher dividends paid by stocks back then.
Key word being "if".
There's a growing expectation that go-forward EPS results are not going to match current estimates - perhaps by a fairly significant amount.
We've already started to see the impact of raging PPI and CPI in Retail, with Target AND Walmart getting crushed pretty hard last week - largely on lower than expected EPS (albeit, and excessive inventory).
Most of the big Wall Street firms seem to be stubbornly clinging to their prior SPX EPS estimates..but a bunch of the folks I follow closely and respect are pretty much all saying these estimates are currently too high and will come down "soon"..guess we'll see..
^^^^^ “Sell down to the sleeping point.” - J.P. Morgan
^^^^^ “Sell down to the sleeping point.” - J.P. Morgan

^^^^^ “Sell down to the sleeping point.” - J.P. Morgan
So how many of these posts include the effects of dividends?
Especially when you're talking about recovery back to a certain level, you need to include the effect of dividends payments.
E.g. the 1929 crash didn't take nearly as long to get back to even as most think just looking at price level given the higher dividends paid by stocks back then.
The deflation that took place at the outset of the Great Depression was the most dramatic that the U.S. has ever experienced Prices dropped an average of nearly 7% every year between the years of 1930 and 1933. In addition to a drop in prices, there was also a dramatic drop in output during the Great Depression.