Yes.
But a few months ago, I recall seeing headlines about people running out of money that fell from the sky like manna. That money should be gone already.
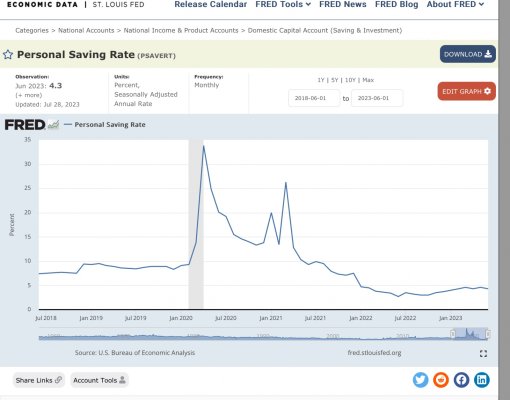
Recently, I saw headlines about savings rate dropping. I don't know if it has gone negative yet, meaning people dipping into their savings to live on.
Transfers that went to lower income segments are probably spent, as the propensity to spend is quite high in the bottom income half of households. Transfers also went to higher income households and businesses, which have a lower propensity to spend, so it would be no surprise if there were still a positive balance of a pandemic related asssitsnce.
After working through the impact of the pandemic assistance, the savings rate doesn’t look negative or trending down, although it is a bit lower than pre-pandemic levels https://fred.stlouisfed.org/series/PSAVERT
Attachments
Last edited:
