All the TA I've seen in the past seemed like magic mojo stuff to me. I've never seen anything that indicates it works. Part of the problem seems to be that no one can define what TA is. If you ask 10 chartists what this chart is saying, you get 10 different answers. Most of the answers tend to include, 'this indicates that we could be going up near term, but possibly after a down cycle, and we can't eliminate the possibility for a sideways move at this time - unless new information comes to light'.
But it may be ignorance on my part. I'd be very interested in seeing some concrete evidence of a technique that works. The best evidence would be from a mutual fund manager that uses a TA strategy that consistently beats the risk-equivalent index in up and down markets.
If you can provide that, please start a new thread, and PM me in case I miss it please - I would be interested.
-ERD50
I guess I'll attach to this post since both were somewhat similar questions, but yours more complex.
It's true that many "chartists" try to use absolutely anything and everything to draw some sort of channel or trendline. In my opinion, those using short term trend lines, get short term results (which I find pretty much useless being that I'm not a day trader).
I use the 50 and 200 day moving averages (take the last 50 or 200 days of trading, look at their closing price, and divide by either 50 or 200), which are pretty simple to get in almost any program. Now, I can't say whether the reason they work is because it's a purely formed average line, or else it works because other chartists are also watching the same line, but I've been using it now for over 15 years, and it has worked out pretty well for me.
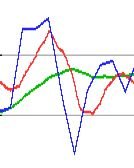
If you'd like to see what a chart looks like, merely bring up a three to five year chart, put in the criteria of 50 and 200 days, and you should see that currently we are trading between those two lines, which indicate to me, that the market hasn't currently picked a direction (I know that's useless info right now). However, once the index moves above the support line or through that current resistance line, I believe you should know whether or not you want to be holding cash, or getting invested.
I admit it's not a perfect system, but truly, if you want to see if it works, just pull up a chart right now, enter DJIA or COMP or any symbol for that matter and see if they don't at some points, hold those lines (either above or below them), and when they break through, they tend to continue breaking through.
In any case, for me it beats the heck out of waiting for someone to report how good their earnings were in the last quarter, and seeing that three weeks earlier there was very heavy volume in the stock.
BTW, all just my own opinion and research.