2015 YTD investment performance thread

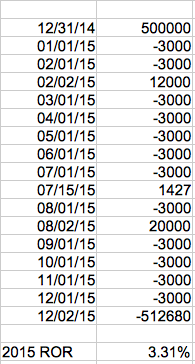
Morgan-Stanley account: up 0.3%. Fidelity: up 1.5%, overall 0.5%. Method: XIRR, then adjusted to YTD by raising it to (11/12) power. I've got a decent amount of bond funds, which dragged yields down, but the big culprit was a high-yield Chesapeake Energy bond I bought at par for about $25K, now worth $11,750. Ouch. Morgan-Stanley return would have been 0.6% without that drop. I'm still hanging onto it.
 
Up 3.2% YTD (excluding any additions - no withdrawals (not yet retired)). Not sure which formula is being used to calculate this number.
 
Up 2.3% YTD as of yesterday's close. This is slightly below a 60/40 benchmark of VTI/BND, which was up 2.5%.

The lag is driven by international emerging markets, a high-dividend ETF that is overweight energy/utilities, and high-yield corporate bonds. Our real estate holdings continue to do quite well, which partially offsets these effects and keeps performance close to the benchmark.

FWIW, I do 2 return calculations and reconcile the two:

1. YTD change in total portfolio balance divided by beginning-of-year balance. The current balance is adjusted for ins/outs during the year, including the related performance impact.
2. Look up YTD total return for each holding in M*. Mix weight on beginning-of-year balances. Adjust for any portfolio changes during the year.

For today, the first method resulted in 2.34%. The second was 2.33%. For analytical purposes, I find the second method to be far more useful. I can quickly see subsets of the total, such as asset classes and individual holdings. This enables analysis of what's working and what's not, including what-if type changes. I only do the first method at the total portfolio level, and mainly just as a reconciliation or reality check before I run with the M* numbers. Since it's at the total portfolio level, there's little-to-no analytical value.
 
I'll be lagging many of you when all is said and done and 2015 is in the books, but that's OK.

I think threads like this are very good in providing a survey of sorts where people provide an honest effort at accurately reporting investment performance numbers in a way that is comparable over a reasonable length of time. Here's hoping to see another of these threads in the New Year!

My main reason for creating this thread was to share info on what investment is working YTD, beyond the result. I didn't expect protracted discussions on how to report the result. But that's good, too. I enjoy reading the posts about what to include in the result.

I will open a 2016 YTD perf. thread in sometime Jan. :cool:
 
As I'm sure most folks have access to MS Excel or OpenOffice, it would be quite easy to standardize this calculation. Below is a portfolio starting the year at $500K and withdrawing $3000 on the first of each month. There are also deposits to the portfolio on Feb 2 and Aug 2 of $12K and $20K respectively. You can see that in this example on Dec 2 the portfolio was worth $512,260. This is entered as a negative number in the spreadsheet. I would set the last date cell to =TODAY() so it automatically shows the current date and you don't have to keep changing it.

To get the rate of return, the cell is set to =XIRR(B4:B20;A4:A20) in this case. Your cell columns would be wherever you have it in the spreadsheet.

This is so easy and I hope it makes sense.
 

Attachments

  • Screen Shot 2015-12-02 at 1.02.12 PM.png
    Screen Shot 2015-12-02 at 1.02.12 PM.png
    21 KB · Views: 160
For comparison:

The ROR for the above situation is 3.31%
If you use Quicken's formula the ROR is 0.48%.

The actual return is almost 7 times higher. Quite a difference. You might as well not even calculate the return if you arent going to do it right.
 
How about ($now - $start - $added)/ ($start - $added)?

For example, if $start =100, $added =20 and $now = 130 then the gain of 10 divided by the average invested balance of 110 is 9%

Sorry folks... I mistyped the formula... it should have been:

($now - $start - $added)/ ($start + 1/2 $added)
= (130 - 100 - 20)/ (100 + 1/2 * 20)
= 10/110
= 9%

Works ok for a full year but is a bit off early in the year. XIRR is better.
 
Last edited:
My main reason for creating this thread was to share info on what investment is working YTD, beyond the result. I didn't expect protracted discussions on how to report the result. But that's good, too. I enjoy reading the posts about what to include in the result.

I will open a 2016 YTD perf. thread in sometime Jan. :cool:


I didnt really explain why my results were so good comparatively speaking but since you want to know, I will.... Disclaimer: past performance does not predict future performance. :). Last year I found my stomach waning for potential market losses in mutual funds and sick and tired of earning nothing on IBonds and CDs. Studied preferred stocks and bounced around a few ideas with fellow posters here and developed my plan. Got my 6.5% average yield all wrapped up for the year except for a some late December dividends needing to be kicked out. Made some seriously easy money trading CHSCL and CHSCM cap gains plus dividends, plus a few others. All issues but one now (thanks to today) are higher than purchased. That is really immaterial as I invest for the income not stock appreciation. Safe was well rewarded this year. Next year who knows, but as I mentioned earlier the companies are 100% safe so price dips are actually begrudgingly appreciated since I reinvest all divis plus leftover income money each month.


Sent from my iPad using Tapatalk
 
.....For instance, if I had $1M on 12/31/14, invested $20K so far this year, and yesterday's balance was $1.2M, I'd get the following:

($1.2M - $20K)/$1M = 1.18
$1.2M /($1M + $20K) = 1.17647...

(1.18 + 1.17647)/2 = 2.35647
2.35647/2=1.178235

Drop the 1, and you get 17.8235%
.....

or (1200-1000-20)/(1000+1/2*20)= 180/1010 = 17.82%
 
Here's how I calculate my rate of return...

First, I run two calculations:
A: (current balance - YTD contributions) / balance at beginning of year
B: current balance / (balance at beginning of year + YTD contributions)

Then I take the average of the two.

For instance, if I had $1M on 12/31/14, invested $20K so far this year, and yesterday's balance was $1.2M, I'd get the following:

($1.2M - $20K)/$1M = 1.18
$1.2M /($1M + $20K) = 1.17647...

(1.18 + 1.17647)/2 = 2.35647
2.35647/2=1.178235

Drop the 1, and you get 17.8235%

I do it this way, because I'm constantly adding money throughout the year, so part of those additional investments, depending on when I put them in, earn money (or lose money) as well. Rather than try to keep track of when I put in every little bit of additional investment, I figure this approach, helps give a reasonable average....

I'm kind of in the same situation and have been trying to figure out how do I determine what my contributions were vs. the total return. I have several accounts that I contribute to and during the year I've changed the amounts. Some are pretax and some post tax. pretax are easy I can see those on my pay stub but post-tax I guess I'd have to manually go into each account and figure out. I was hoping Personal Capital or Mint would have a slick way to figure those out but I don't see it.
 
For comparison:

The ROR for the above situation is 3.31%
If you use Quicken's formula the ROR is 0.48%.

The actual return is almost 7 times higher. Quite a difference. You might as well not even calculate the return if you arent going to do it right.

Start = $500,000
End = $512,680
Withdrawal = $36,000
Deposit = $33,427

Using the simple formula ($now+$removed)/($start+$added), I get 2.86%. It is off, but not as bad as you show.
 
Start = $500,000
End = $512,680
Withdrawal = $36,000
Deposit = $33,427

Using the simple formula ($now+$removed)/($start+$added), I get 2.86%. It is off, but not as bad as you show.

My bad. It is still off about as much as the other example. About 13%....but this time the actual result is higher. Last time it was about 13% lower. That's a pretty big variance between reality and the estimate.

Anyone with Excel can do the calculations the correct way in less than 10 mins. Im not sure why they wouldnt want to.
 
5.6% to Dec 1st including dividends but not including $225k of new contributions (about $144k into investment accounts and the rest into "high" interest savings).
 
My bad. It is still off about as much as the other example. About 13%....but this time the actual result is higher. Last time it was about 13% lower. That's a pretty big variance between reality and the estimate.

Anyone with Excel can do the calculations the correct way in less than 10 mins. Im not sure why they wouldnt want to.

A reasonable approximation is the formula I provided earlier of the "gain" divided by the average invested balance. In this case, $15,253 gain divided by $498,714 average invested balance for a return of 3.05%... pretty close to the 3.31% but a much simpler calculation.
 
My bad. It is still off about as much as the other example. About 13%....but this time the actual result is higher. Last time it was about 13% lower. That's a pretty big variance between reality and the estimate.

Anyone with Excel can do the calculations the correct way in less than 10 mins. Im not sure why they wouldnt want to.

Because they are lazy? Like me?

It is true that to compare investing prowess, we need to use a more exact method. But is it really that important? In the end, we all want to have more money, but how we draw our money makes a difference too, not just how we invest.

Some people like to draw all the money they need at the beginning of year and put it in some place safe, instead of drawing what they need throughout the year. In a bull market, that works against them, compared to leaving the money in the market. Conversely, if the market drops through the year, having that money out in cash reduces the loss.

Or everybody talks about rebalancing, but some rebalance religiously on Jan 2nd, some by using a threshold. Sometimes one method works better, the other times the other one does.

So, the comparison here is just as a lark. Someone who is heavy in REITs would do well earlier this year, and not so well now. It's so fluid, so why split hair?
 
Last edited:
about 3% ytd on a 45/45/10 mix
 
Well I feel bad after reading this - my portfolio, beginning year balance is down 2.2%, dividends paid around 54K, (invested in High Dividend oil and consumables -Added around 200k in 2015 so portfolio did grow but only from dividends and monies added.


I still feel bad
 
Well I feel bad after reading this - my portfolio, beginning year balance is down 2.2%, dividends paid around 54K, (invested in High Dividend oil and consumables -Added around 200k in 2015 so portfolio did grow but only from dividends and monies added.


I still feel bad

I would not feel bad about that situation.
 
Loss of 2.2% versus benchmark... so far with one trading week remaining in 2015.

The loss seem to be mostly from the international fund VXUS, which is down significantly for the year. Specific sector components within VXUS seem to be energy as well as the unhedged FX situation a la stronger dollar.

.
 
Just ran my numbers for the year. All things combined, down 1.3%.
 
It's all too theoretical for me, being in the distribution phase and having bought a house this year.

I suppose I could sit down and look at the changes in share prices for each fund this year, and distributions, and determine what would have happened to a theoretical portfolio with my AA which remained pristine and untouched all year.

But as much as I love numbers and calculations of imaginary scenarios (I do!), still I'm not inclined to do this today. :)

I can give a lower boundary for my portfolio performance, though, by giving real numbers instead of something theoretical. In reality my portfolio is down 4.6% including living off of it, and also including the expenses of buying a new, more expensive home in cash, moving, and selling the old paid off home.
 
Last edited:
In reality my portfolio is down 4.6% including living off of it, plus the expenses of buying a new, more expensive home in cash, moving, and selling the old paid off home.
Similar calculations here. Living expenses and buying two new cars for cash in the past six months took me into 1.3% negative territory this year.
 
Looks like a break-even year for me assuming not much changes in the market this week, right now down 0.04%. 60/33/7 but will move to 60/35/5 as we spend down more cash next year.
 
Also just finished tallying up everything for the yr. Due primarily to the small portion of tax deferred in my megacorp employer stock plus some lucky choices in stock purchases early in the yr in self managed. up 3.5% for 2015, my last yr of 12 months of full time employment.
 
Back
Top Bottom