mistermike40
Recycles dryer sheets
- Joined
- Aug 6, 2014
- Messages
- 379
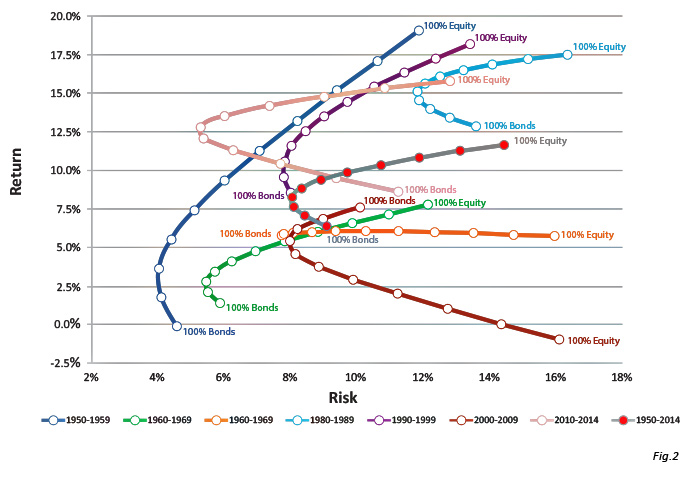
I've recently decided to shift my AA from 80/20 to 60/40. Doing a bit of Internet research (not always a wise thing to do), I found that 60/40 historical results aren't much different than 40/60 (8.7% vs 7.8%, not accounting for inflation):
https://www.financialsamurai.com/historical-returns-of-different-stock-bond-portfolio-weightings/
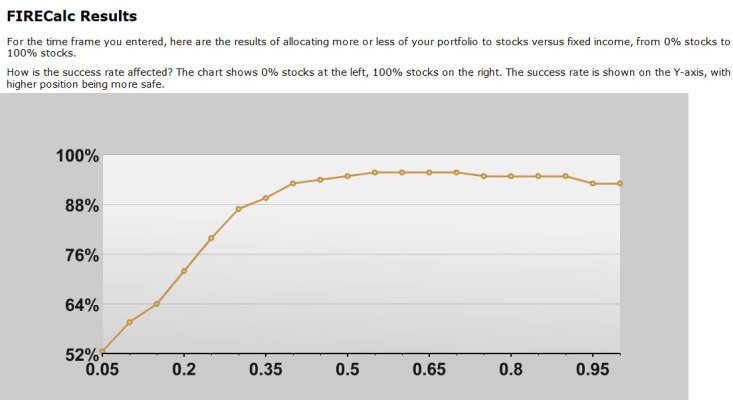
Another article claimed that 30/70 is more of a "sweet spot":
https://www.forbes.com/sites/rickferri/2015/02/06/the-center-of-gravity-for-retirees/#48984ca95dae
I have never considered going below 60/40, but the above articles make me wonder. I'm not asking what everyone's AA is (I'm sure there have been a hundred such polls conducted here)... I'm just curious if you think the above information is accurate.
https://www.financialsamurai.com/historical-returns-of-different-stock-bond-portfolio-weightings/
Another article claimed that 30/70 is more of a "sweet spot":
https://www.forbes.com/sites/rickferri/2015/02/06/the-center-of-gravity-for-retirees/#48984ca95dae
I have never considered going below 60/40, but the above articles make me wonder. I'm not asking what everyone's AA is (I'm sure there have been a hundred such polls conducted here)... I'm just curious if you think the above information is accurate.
.jpg")