I don't have any idea what this sentence is trying to communicate. I also don't understand the chart. I tried to find it at
https://realinvestmentadvice.com/ but could not.
It's trying to say that in my opinion, equity risk is often under-appreciated by many - even on ER. I frequently see statements like "what's so bad about a bear market? They typically only last 18 months, on average..". Yes, and they can wipe out 50+% of your equity value. When that happens, it can take DECADES to recover. That's the point I was trying to make.
First, it is titled " ... Total Return." Return is conventionally expressed in dollars or as a percentage. The chart does neither.
I believe it's exactly that - Total Return (including dividends), as measured in value of an investor's portfolio. The article linked below also says it's adjusted for inflation.
Second, it appears to be trying to make some point about where the S&P 500 has been since around 1900. Wikipedia, however, tells me that the index was created in 1957.
Fair question and good point..let's ask the author (from SeekingAlpha) to net that out. I'd guess he's using other, pre-S&P500 index data for "market return" prior to that point and should have made that more clear in the chart.
Third, if it is trying to make some point related to the nominal value of the index this is fallacious because total return, including dividends, is the name of the investing game.
My assumption since it said "total" return was that dividends were included.
Fourth, the whole site is a hustle. For example, they trumpet being in Financial Times list of top advisors. The fine print defines selection criteria: "Applicants were then graded on six factors: assets under management (AUM); AUM growth rate; years in existence; advanced industry credentials of the firm’s advisers; online accessibility; and compliance records." IOW, how good is the firm at selling? Nothing about performance.
Not sure that their performance as an advisor is relevant to the core data. If the data is wrong, then it'd be good to show how with hard data to refute the points made.
@24601NoMore, I'd appreciate a link to the chart and its explanation. I am actually quite curious.
Here ya go..
https://seekingalpha.com/article/4200284-longest-bull-market-history-happens-next
Nobody does. Probably nobody wants to go to the dentist either. But both are good for you in the long term.
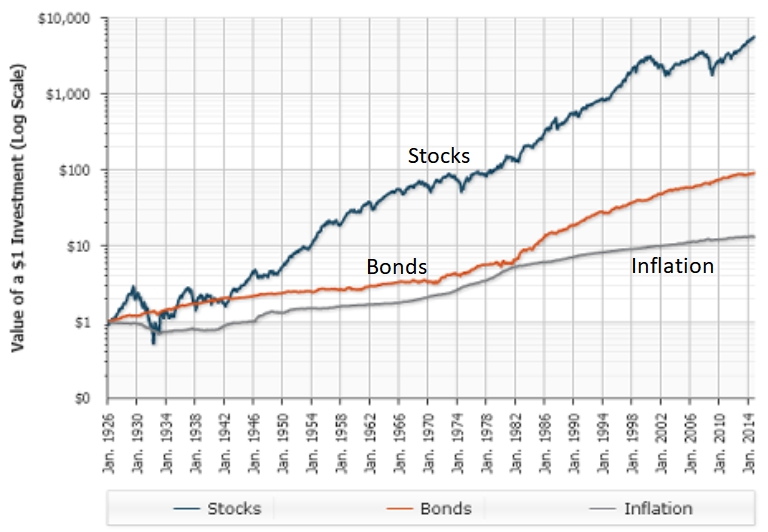
Here is a chart I use with my "Investing for the Long Term" class:
Note that it is in dollars and the y-axis is a log scale. The takeaway from the chart is that a long term investor's
real risk is to be afraid of equities. What is long term? I tell them five years minimum but to think in terms of decades. I also remind them that, actuarilly, a newly retired investor probably has at least a couple of decades ahead.
Good advice, IMHO for young investors or those who are OK with riding out a 10-20 year potential downdraft in their portfolios. It's also often said that you should not have "any" money in equities that you need within the next ten years.
Agreed, SORR is real but as has been discussed in this thread and many others, the risk can usually be minimized with an appropriate AA. IMO it is not a good reason to be paranoid about equities. Obviously, YMMV.
I'm just commenting on my own willingness and need to take risk at this point (year one of ER). I'm not willing to watch a 50+% drop in a big part of my net worth ever again, as I may not have time for things to recover. As Rick Ferri (wisely, IMHO) said most investors should not be investing anywhere near their willingness to take risk, but instead should focus on the minimum amount of risk possible to achieve the income they need. I think that's wise advice and contrary to the "go, 80/90/100% equities!! If a bear market happens, oh well!" I often see on the forum - and from people who really don't "need" to take a 80/90/100% equity position.
So, to net it out - if you don't "need" to take high equity risk to pay the bills and meet your long-term goals through a projected end of life date (I used 95 for us), then as William Bernstein famously said.."when you've won the game, quit playing". I haven't entirely quit playing - but I'm acting tactically by maintaining an AA that the data since 1926 (per Vanguard at
https://personal.vanguard.com/us/insights/saving-investing/model-portfolio-allocations?lang=en) shows returns an average of 6.6% per year with the worst year being -10.1%, the best year being 29.8% and the # of down years being 13 of 93. Contrast that with worst year of -34.9% often followed by probably another year or two of -20+%, avg annual return of only +2.8% above 20/80 and 24 out of 93 down years for an 80/20 AA. To me, an additional 2.8% is not worth that kind of risk to go from 20/80 to say, 80/20 - because watching a 50+% equity melt-down like we did in 2008 is not anything I can or want to repeat at this point in life..and if I can hit an average of 6.6% return over time with a 20/80 AA, then I'm down for that all day long as we would meet all of our financial needs through age 95+ and them some, with that type of return..