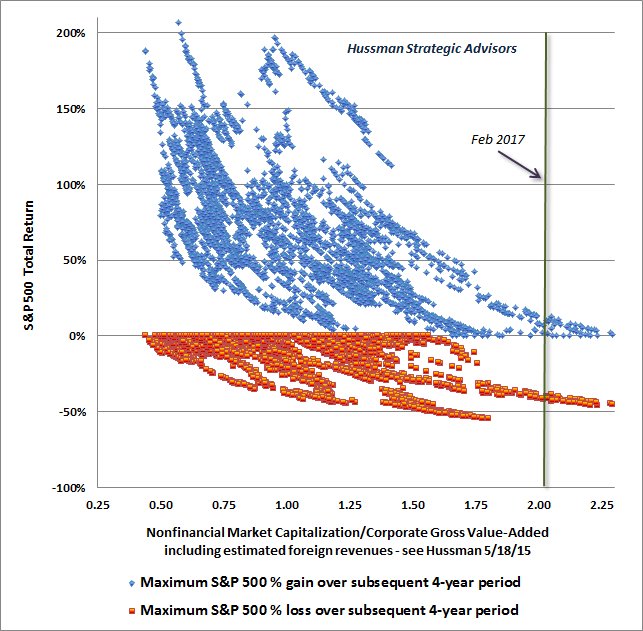
First graph I have seen in a long time that makes me want to sell stocks

CAPE has been a(n) (unhealthy?) fascination of mine for quite some time, but have always been disappointed with any idea pursued. There is just something unseemly about this use of accounting numbers that are based on GAAP rules that change over time that that slowly accrues a pit in my stomach to the point where I have to unwind the fascination before too long.

Hadn't searched for CAPE investment ideas in a while before reading this post, but found the venerable Dr. Damodaran has a couple of relatively recent blog posts that are interesting food for thought for CAPE-crusading market timers.

Musings on Markets: Mean Reversion: Gravitational Super Force or Dangerous Delusion?

Musings on Markets: Superman and Stocks: It's not the Cape (CAPE), it's the Kryptonite(Cash flow)!

Things that make you go hmmm... :whistle:

Apologies in advance to those who find any parts of this post of this punny. Bad week at w*rk and this post is, unfortunately, my outlet.

The good Doctor amuses me with his cash flow valuation techniques that he favors --- he perceives he can value Apple and buy at $115 as undervalued and sell at $135 as fully valued a stock with so many entanglements it boggles the mind. He amused me even more when he values Valeant in 2015 at $208 when it was trading at $200 or when he valued it at $42 when Valeant traded at $32, he is just like all the good bull market salesmen for hedge funds looking to sell people that they understand a companies business model exactly and can price the value of the business today at a dollar figure. To watch the justifications as a stock price drops 90 percent and to be able to display an exacting confidence that you know to the dollar what a business is worth is very … amusing….. perhaps the most amusing thing to me was the surety of his valuation of Valeant’s asset in place as being worth more than $110 per share at a time when Valeant wasn’t reporting proper accounting techniques or whether intercompany sales and cost of sales as well as inventory were properly valued. Never does he try to describe whatever happened to the $95 per share of assets already in place, not being based on future growth.


Current Price per share = $180.00
Number of shares outstanding = 344.90
Do you want me to adjust trailing numbers for Salix acquisiton? No
Drop in operating income from pricing fix 0.00%
Expected growth rate for high growth period = 3.00% Length of period in cell B21
Input page
Market inputs for your company
Market Capitalization = $62,082.00
From the balance sheet This year Last year
Book value of equity = $6,464.70 $5,312.00
Total Debt Outstanding = $30,883.30 $15,253.90
Cash & Marketable Securities = $1,420.00 $322.60
From the income statement
Revenues $9,990.10 $8,263.50
Operating income (EBIT) = $4,977.13 $3,901.19
Effective tax rate = 16.51%
Net Income $610.00
Your growth inputs
Expected growth rate in operating income= 12.00%
Return on Invested capital on growth = 19.90%
Length of growth period = 10
Your cost of capital inputs
Cost of equity = 10.17%
Cost of capital = 7.72%
Riskfree rate = 2.00%

Intrinsic Value
Value of assets in place = $53,837.35
Value added by future growth = $47,420.27
Intrinsic enterprise value $101,257.63
Intrinsic equity value $71,794.33
Intrinsic equity value per share $208.16
 
Sounds like silly assumptions, indeed look like it's engineered to match whatever the price was then. One of my major issues with mainstream analysts: they don't dare to deviate. Then again, hindsight and all.

But 19.9% return on capital invested? Valeant has never had that.

Once that buying spree started in 2010/11 all bets are off. It seems what went wrong (besides the fraud) is to use the history pre-2010 as a model for the acquisitions post. 1.2 USD earnings per share for a 1 billion business doesn't translate into a 12 USD earnings per share for a 10 billion business if you do it wrong.
 
Just curious...anybody know how much the CAPE-10 ratio will drop over the next two years as the 2008 corporate losses fall out of the calculation?

More importantly, is that coming drop relevant to those who follow CAPE as an indicator? One could make the case that a bad 2008 earnings year averaged with nine relatively normal-to-high profit years is more representative of the long term averages than the potential for 10 years (2009-2018) without a major recession or market correction.
 
Yes, in an inflationary period the rise in P should be cancelled out by a rise in E (often not, because a company may not be able to raise its price without hurting sales).

However, with higher inflation people want a better E for the same P. If I can buy a CD that pays 10%, I do not want a $100 stock that gives me only $5 of earning (P/E of 20). In fact, if I can get a CD rate of 10%, I would want a P/E ratio way below 10 because I need a risk premium.

Hence, the P/E ratio contracts while inflation rises, and expands when inflation drops. We have had low inflation since 2009. Will that continue?
I think I get that. And I can see it in the data (Chapter 26 Shiller Irrational Exuberance data, blue is inflation, pink is PE). But when I switch it over to PE10 (yellow), I can't see it any more. Only goes to 2012 because the data only went that far in that data set.
 

Attachments

  • peAndInflation.jpg
    peAndInflation.jpg
    130 KB · Views: 29
  • pe10AndInflation.PNG
    pe10AndInflation.PNG
    21.1 KB · Views: 31
Looks to me that it is still there in the PE10, but because of the averaging effect over 10 years, it is more subdued.

Plus, using trailing 10-year average data means there's a lagging effect. You will need to shift the yellow line 5 years to the left, because it represents the average P/E at the midpoint of the past 10-year period.

PS. The P/E expansion is evident in this plot. For the same inflation factor as in some past periods, investors are now willing to pay for a higher P/E. Hope they will continue to do so, else we retirees are all screwed. That's the P/E contraction that Shiller and even Bogle fear.
 
Last edited:
Hussman is quite smart and I used to read his monthly newsletter; I try to check back a couple times a year.

That said, the returns on his "hedged" fund (it's called the Strategic Growth fund now) for the last 10 years have been, to underestimate, dreadful--negative 5.46%, annualized. It did only lose about 9% in '08 and up 4.6% in '09, which was quite impressive.
His "unhedged" fund, last time I looked, was bad but not shoot yourself in the head horrible.
Based on CAPE earnings, he has downward hedged stock gains since (I think) 2010 or so, and his investors have paid a horrible price.

And he will be right, at some point, as you say. His monthly letter is worth reading, if you're feeling too bullish.


That's what I am afraid of. That is it's about time he is right. :)

I only know of Hussman from earlier mentions on this forum. I saw the performance of one of his funds. It sailed right through the 2008-2009 Great Recession and went up slightly, but trailed the S&P in the last few years. Maybe he gets to say again "I told ya!".
 
Last edited:
Just curious...anybody know how much the CAPE-10 ratio will drop over the next two years as the 2008 corporate losses fall out of the calculation?

Around 5% on the CAPE-10. Not enough to substantially change the picture. And as you pointed out, the questions is whether it is fair to exclude it.

I think partially, yes: alot of companies took the panic as an excuse to mark down stuff alot so they can claim great results later on, and cleanup skeletons in the closet without taking responsibility ("it's the crisis!").

And you have mark-to-market knockon effects (listed asset management firms).
 
Just curious...anybody know how much the CAPE-10 ratio will drop over the next two years as the 2008 corporate losses fall out of the calculation?

More importantly, is that coming drop relevant to those who follow CAPE as an indicator? One could make the case that a bad 2008 earnings year averaged with nine relatively normal-to-high profit years is more representative of the long term averages than the potential for 10 years (2009-2018) without a major recession or market correction.

Great point. Got me thinkin' and searchin'; even worse, seeing your avatar has me wishing I was in Houston as I could really use a visit to Rudy's BBQ. Nothing like a half-pound of brisket to cure what ails you. But, I digress.

None other than Dr. Jeremy Siegel published a paper last year about improving the forecasting efficacy of CAPE by avoiding GAAP reported earnings altogether and using NIPA earnings. Doing so avoids the currently popular accounting practice of "kitchen-sinking" (taking every write-off possible when a company has a bad quarterly report a la 2008-09) as well as non-comparable historical earnings comparisons due to the slowly evolving GAAP rules.

Lots of interesting observations to read. This got my attention...
In this article, I offer an alternative explanation of the elevated CAPE ratio. ... Changes in accounting practices since 1990 have depressed reported earnings during economic downturns to a much greater degree than in the earlier years of Shiller’s sample. Because the CAPE ratio takes into account the last 10 years of earnings, any stock return forecast issued before 2018 will include the extraordinarily low earnings of 2008–2009 and may be biased downward.

Interestingly the write-downs of just AIG, Citigroup, and BofA caused the majority of the negative $23.25 S&P earnings in 2008. Had the 2008 GAAP earnings been calculated with the GAAP rules in place prior to 1992, $80 billion in write-downs from these three firms would not be included in the GAAP earnings calculations.

Further,
... it is puzzling that the decline in S&P reported earnings in the 2008–09 recession—when the maximum decline in GDP was just over 5%—was much greater than the decline in S&P reported earnings in the Great Depression, when GDP declined five times as much. ... These disparities also suggest that there has been a change in the S&P methodology from likely understating declines in earnings during economic downturns to significantly overstating them.

Another area in the article that stood out to me was how well CAPE actually does at predicting future 10-year real equity returns. As originally published by Dr. Shiller, CAPE has a coefficient of determination (R^2) of 0.35 which means the CAPE model "explains" about 1/3 of the future 10-year real equity returns which means the remaining 2/3 of variation in future returns is not accounted for in the CAPE model. A good result no doubt, but clearly not deterministic.

The full article is entitled "The Shiller CAPE Ratio: A New Look" if you want to google it and read the full-meal deal. Having problems with posting links.
 
The increase in my stock investments this year scares the heck out of me. Unfortunately I think bonds won't be a safe harbor until banks finish lightening their holdings.
 
The increase in my stock investments this year scares the heck out of me. Unfortunately I think bonds won't be a safe harbor until banks finish lightening their holdings.

Cash, my lady, cash. There's that 3rd choice outside of stocks and bonds.
 
If a large part of a retirees investments is in retirement accounts, these market-valuation sensitive shifts can be costless, other than any poor judgments involved.

But is the account is taxable, changes are expensive with tax, and even more so in our brave new world of Medicare, ACA and other price sensitivity to AGI plus whatever phaseouts, etc., etc.. I require a pretty high bar to create taxable gains.

Ha
 
Last edited:
I see that many of the comments have swung over to CAPE-10, however the graph that caused me to shudder has nothing to do with earnings whatsoever and is an individual matter from that - it is in essence the stock value of companies that produce things divided by the value of what they produce.

I have no plans at present to actually reduce my stock holdings other than if a stock were to meet my selling criteria as part of my normal ongoing reviews of my stocks. B
 
The numerator seems pretty subjective to me... how do they measure the value of what is produced by Amazon, Google, Twitter, Facebook, etc?
 
Facebook data from the Feb 2017 10K for 2016 results:Note 13. Geographical Information
Revenue by geography is based on the billing address of the marketer or developer. The following tables set forth revenue and property and equipment, net by geographic area (in millions):
Year Ended December 31,
2015
Revenue:
2016
12,579 $ 15,059
$
2014
6,817
12,466
2015
4,498
1,189
5,687


United States
Rest of the world (1)
No individual country, other than disclosed above, exceeded 10% of our total revenue for any period presented.
$
$ 17,928 $
December 31,
2016
6,793 $ 1,798
$
5,649
8,513
9,415
Total revenue
$
27,638


(1)
Property and equipment, net:
United States
Rest of the world (1)
$


Total property and equipment, net
$
8,591


(1) As of December 31, 2016 , property and equipment, net in Sweden no longer exceeded 10% of our total property and equipment, net. As of December 31, 2015 , such balance was $713 million . Other than disclosed, no individual country exceeded 10% of our total property and equipment, net for any period presented.
Note 14. Subsequent Event
 
Cash, my lady, cash. There's that 3rd choice outside of stocks and bonds.

Oh I have that outside of retirement accounts, over a year of our needs not met by pension/SS.

I do abide by "buckets".
 
I also miss Otto's, Ray's, and Burn's Original BBQ in downtown Houston.
There is one decent place in Reno.

Great point. Got me thinkin' and searchin'; even worse, seeing your avatar has me wishing I was in Houston as I could really use a visit to Rudy's BBQ. Nothing like a half-pound of brisket to cure what ails you. But, I digress.

None other than Dr. Jeremy Siegel published a paper last year about improving the forecasting efficacy of CAPE by avoiding GAAP reported earnings altogether and using NIPA earnings. Doing so avoids the currently popular accounting practice of "kitchen-sinking" (taking every write-off possible when a company has a bad quarterly report a la 2008-09) as well as non-comparable historical earnings comparisons due to the slowly evolving GAAP rules.

Lots of interesting observations to read. This got my attention...
In this article, I offer an alternative explanation of the elevated CAPE ratio. ... Changes in accounting practices since 1990 have depressed reported earnings during economic downturns to a much greater degree than in the earlier years of Shiller’s sample. Because the CAPE ratio takes into account the last 10 years of earnings, any stock return forecast issued before 2018 will include the extraordinarily low earnings of 2008–2009 and may be biased downward.
Interestingly the write-downs of just AIG, Citigroup, and BofA caused the majority of the negative $23.25 S&P earnings in 2008. Had the 2008 GAAP earnings been calculated with the GAAP rules in place prior to 1992, $80 billion in write-downs from these three firms would not be included in the GAAP earnings calculations.

Further,
... it is puzzling that the decline in S&P reported earnings in the 2008–09 recession—when the maximum decline in GDP was just over 5%—was much greater than the decline in S&P reported earnings in the Great Depression, when GDP declined five times as much. ... These disparities also suggest that there has been a change in the S&P methodology from likely understating declines in earnings during economic downturns to significantly overstating them.
Another area in the article that stood out to me was how well CAPE actually does at predicting future 10-year real equity returns. As originally published by Dr. Shiller, CAPE has a coefficient of determination (R^2) of 0.35 which means the CAPE model "explains" about 1/3 of the future 10-year real equity returns which means the remaining 2/3 of variation in future returns is not accounted for in the CAPE model. A good result no doubt, but clearly not deterministic.

The full article is entitled "The Shiller CAPE Ratio: A New Look" if you want to google it and read the full-meal deal. Having problems with posting links.
 
Oh I have that outside of retirement accounts, over a year of our needs not met by pension/SS.

I do abide by "buckets".

No, I mean real cash, as an AA substitute for bonds when I think bond's prospect is not commensurate with its risk.

I have 32% cash, because I do not like bonds now. But if I like to think of it as a buffer for spending, that's 10 years even if we still delay SS. However, if things get that bad for stocks for that long, we will draw SS earlier than planned.
 
Keep in mind we're 8 years into an expansion, we've never gone past 10 without a recession. Different this time? :wiseone:
 

Latest posts

Back
Top Bottom