I'll Show You Mine, If You Show Me Yours...

rescueme said:
That's what happens when you use MS/Word to create a post and then copy/paste it without knowing what the BBS will post it as (in look) even though it looks good to you at the time of posting :D ...

BTW, I thought there was a good representation of "post-boomers" on the board, based on some current negative responses to me recently (no, don't want to start a fight - just an observation) of those that were born after 1964. That would be anybody of the current age of 48 or less. That falls within your 55 +/- but not by much.

Just a simple observation...
Ok rescue, you have caught me in the middle.... I wasnt born after 1964, but Im still not yet 48 either. So I dont know whether to agree with you or disagree :) FWIW- Take some small comfort in knowing no matter how bad your chart came out, it is still better than anything I could have done!
 
It was interesting (but not surprising in this economy/market) how some people have eschewed bonds for cash equivalents.
I've always been suspicious of that "reduce volatility of your equity portfolio by holding bonds" bromide.

What about reducing volatility by holding cash?

We put some of our daughter's college fund into EE & I bonds because of the tax-free benefits (not because of the economy or the market). We've avoided bonds in our ER portfolio for over 25 years because (1) they were way underperforming equities, (2) cash seemed to reduce our volatility as well as bonds, and (here's the big one) (3) if you have a defined-benefits pension (or an annuity) then you're already carrying a pretty heavy slug of bonds in a portfolio.

Hypothetically, when retirees start drawing Social Security then they should reduce their asset allocation of bonds. Hmm.
 
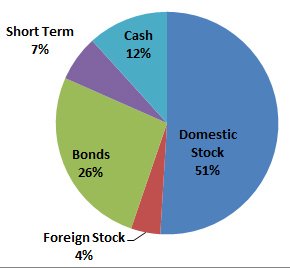
Here's mine. Domestic stocks are at the high end because of some stock that I received in an ESOP in 1980 and has been accumulating. Cash is mostly CD's and interest earning accounts.
 

Attachments

  • Untitled-2.jpg
    Untitled-2.jpg
    59.5 KB · Views: 106
a. SP 500 Index (& active funds) 10.16%
b. US large cap value 4.12%
c. US mid cap inx 2.47%
d. US small cap inx 2.55%
e. US small cap value inx 2.57%
f. REIT inx 2.79%
g. International LC inx 4.81%
h. International value 3.08%
i. International SC 2.13%
j. Emerging Markets inx 2.54%
l. US Bonds inx 4.43%
m. Foreign Bond fund 1.34%
n. Short term in funds 1.30% (from reports)
o. Family loan/Life Ins. CV 5.09%
p. Cash 5.34%
q. Pension value 45.28% (cost to buy similar annuity)


A recent snapshot, but looking to simplify.
 
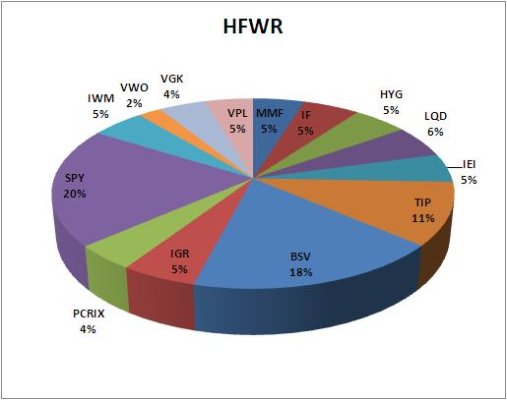
MMF = Money Market Fund
IF = Income Fund
SPY, IWM, and IEI are proxies for the S&P500, Russell2000, and total bond market non-listed private funds with 0.03% ERs in my 401K...
 

Attachments

  • Portfolio.JPG
    Portfolio.JPG
    20.2 KB · Views: 10
Last edited:
My IRA:

45% US Growth Stock ETF
10% Emerging Markets Growth Stock ETFs
20% Real estate company & REITs
10% Gold ETF
5% Oil ETF
5% S&P 500 Short
5% Cash

This is my growth account, if you will. I also have a 401k full of plain vanilla index funds and will receive a pension.
 
Back
Top Bottom