Monte Carlo simulation

I was familiar with portfoliovisualizer but had never tried the monte carlo thing.

I don't know the details of what they're doing under the hood but that is one of the most hopeful / optimistc monte carlo calculators I've ever run across.
 
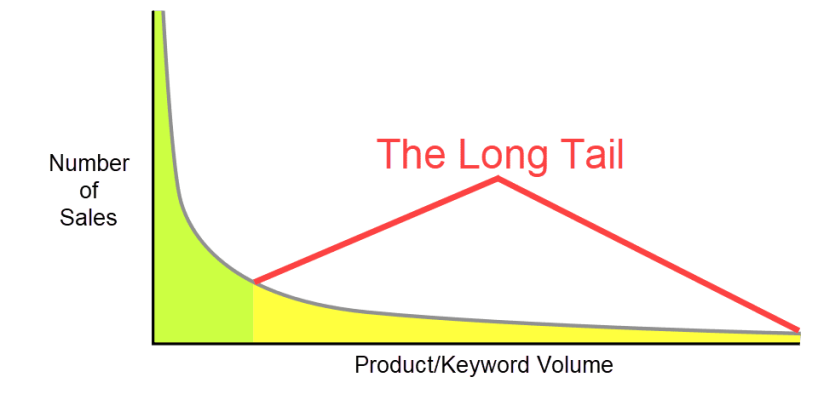
Be aware Monte Carlo simulations often generate long tails never seen in actual history.
 
Excuse my ignorance but what is a “long tail”?

It just means that one side of the curve goes out much farther than the other.
 

Attachments

  • long-tail-graph-1826486427.png
    long-tail-graph-1826486427.png
    7.5 KB · Views: 42
The implication of the long tails is that results from a Monte Carlo sim include both upsides and downsides that have never happened before. That's OK except some of them are probably impossible for all practical purposes. So trying to get past low-90s% success in most MC retirement sims will make you work far too long.

In my observation, exceeding 90% success in MC is similar to 100% success in historical models like FIRECalc.


Makes sense.....I'm so addicted to these calculators...its annoying....
 
The Fidelity calculator uses a Monte Carlo simulation. In their most conservative output choice, for me the results are typically 3-4% more conservative than the results from Firecalc.
 
The Fidelity calculator uses a Monte Carlo simulation. In their most conservative output choice, for me the results are typically 3-4% more conservative than the results from Firecalc.

Can you please send link?
Thanks
 
The Fidelity calculator uses a Monte Carlo simulation. In their most conservative output choice, for me the results are typically 3-4% more conservative than the results from Firecalc.

FireCalc requires an “all in “ number for expenditures. So it’s up to you to anticipate your total spend.

Fidelity takes your budget and adds taxes, inflation and an immediate SORR deduction for the most conservative result. They are not apples to apples so you will get different results. I tend to think Fidelity is more accurate.

They are not apples to apples as one uses a Monte Carlo type simulation and the other uses an historical sequencing concept.
Firecalc uses an inflation rate too and actually by picking the "random" choice, it can mimic a Monte Carlo simulation of sorts.
As for taxes, one can input their own state tax rate, although not Federal.
Not sure one can say Fidelity is more accurate vs. just more conservative.
Effectively it can lump the worst 5 years in history in a consecutive yearly return in addition to the initial SORR haircut. A very unlikely scenario.
 
Keep in mind that Monte Carlo simulations may create scenarios that are highly unlikely to occur, the same can be said for historical actual outcomes. Monte Carly simulations are just another tool, among many, to develop what each individual concludes is reasonable for them given the ever-changing environment of variable factors.
 
Keep in mind that Monte Carlo simulations may create scenarios that are highly unlikely to occur, the same can be said for historical actual outcomes. Monte Carly simulations are just another tool, among many, to develop what each individual concludes is reasonable for them given the ever-changing environment of variable factors.

That's true.
I think the comfortability in using Firecalc stems not so much for the sequencing results providing let's say that one could have 8m left in the best of historical results, but that one could take some comfort that if the results are at 100%, then even in the worst (let's say 30 years) of sequencing the results have never been worse given our portfolio makeup.
Another more recent example is that the Year 2000 retiree although being through 3 bear markets is still not in the top 5 of worst years to start a retirement.
 
AWSHX is a G&I mutual fund that is the oldest one I am aware of that I used in the Portfolio Visualizer to look at spending/ withdrawal over 35 years. While not an exact copy of the S&P, it is fairly close to model the 4,5,6% withdrawal using actual data. Monte Carlo is not something I would sleep well using.
 
Firecalc has an option to set your portfolio returns to 'random performance'. Would that be similar to monte-carlo?
 
Firecalc has an option to set your portfolio returns to 'random performance'. Would that be similar to monte-carlo?

Yes, that is Monte Carlo, but it is a simplified version with a very limited number of runs. And, like all MC, it is based on input parameters that have to be chosen (by you or the modeler).
 
Most Monte Carlo simulators don't deal with auto-correlations, for example. That is, with the US stock market there have been several different regimes of returns over relatively mid-to-long term periods. The only simulator I've seen that attempts to one from Jim Otar.

Here's an article he wrote about the concept, as well as limitations.
http://www.retirementoptimizer.com/articles/mcarticle.pdf

If you're interested, you can obtain a copy from this site (for a fee)
otar retirement calculator

Cheers
Big-Papa
 
Back
Top Bottom