Projecting investment inflation vs. SS increases

FIREmenow

Full time employment: Posting here.
Joined
May 9, 2013
Messages
756
I did some, granted rudimentary, searching and didn't see anything related to this.

In your forecast projections for after retirement, do you assume the increases year-over-year in social security is the same % as the inflation rate eating away at your investments/income?

Seems firecalc uses the same number for each?

Or do you offset them somewhat? I am currently using 3% inflation for investments/income, and 2% for SS increases.

Does this make sense? Anyone already retired for some period have any real data saying one thing or another?

Leaving healthcare out of it for now.....
 
I assume they are the same in my calculations. However, this is likely not ideal for a few reasons.

1) The compounding rate for SS is currently CPI-W, which does not focus on seniors but rather working-age urban and clerical workers
2) Medicare Part D premiums often rise, wiping out part of the increase
3) For seniors, inflation may be higher than for the general population due largely to the higher inflation rate of medical expenses

Yes, medical care is one of the 8 categories computed within CPI-W, but actual spending by seniors may outstrip the portion in CPI-W.

Here is a good article:
https://www.fool.com/retirement/2017/11/06/how-social-securitys-2018-cola-is-calculated.aspx

The reason I assume they are the same is "simplification". In my view this is a detail that would add more complexity than the benefit I get out of it. You do what you wish with it.
 
I don't make any special adjustments for differing inflation rates in my calculations. However, I can tell you that my personal inflation rate for essentials last year was 12.5%. Mostly due to Medical Insurance increases.
 
In your forecast projections for after retirement, do you assume the increases year-over-year in social security is the same % as the inflation rate eating away at your investments/income?

For ease of use I do usually assume they are the same.

In my own spreadsheets I can vary each rate individually. But I'm covered in all cases anyway, so usually I set them to be the same.

Or do you offset them somewhat? I am currently using 3% inflation for investments/income, and 2% for SS increases.

Does this make sense?

Seems perfectly reasonable, if slightly more conservative. I assume you are using the 3% for the growth of your expenses as well.

For sensitivity checking, set them both the same and see if it makes a significant difference in your calculations and hence your planning. For me, it didn't matter enough to be bothered.
 
For ease of use I do usually assume they are the same.

In my own spreadsheets I can vary each rate individually. But I'm covered in all cases anyway, so usually I set them to be the same.


Seems perfectly reasonable, if slightly more conservative. I assume you are using the 3% for the growth of your expenses as well.

For sensitivity checking, set them both the same and see if it makes a significant difference in your calculations and hence your planning. For me, it didn't matter enough to be bothered.

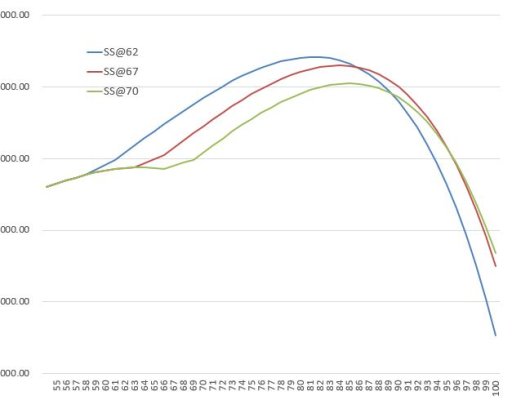
Thanks. More of curiosity more than anything else of what other folks do. I have a spreadsheet that tracks SWR, different SS starting dates, and investment returns. I am currently using this:

Avg Returns 6%
Inflation 3%
SS Increases 2%

Just fun to play around with the numbers.
 

Attachments

  • chart.JPG
    chart.JPG
    31.5 KB · Views: 21
Last edited:
Leaving healthcare out of it for now.....
The only reason I'd do this is healthcare. I think other inflation rates are reasonably captured by the CPI.

Medicare supplement insurance premiums vary by attained age (at least they do for the plans we have). So there is a built in increase by age there. I expect that non-Medicare health related costs like hearing aids and dental work
also increase with age.
 
I like the Personal Capital app’s Retirement Planner. It lets you adjust for whatever inflation rate you want and other variables, and lets you play with all kinds of monetary events. The graphical interface is 100x better than all other outdated retirement calculators I’ve seen. Now, I just hope it does math right.
 
Last edited:
I run my own spreadsheets using a 4% inflation rate and 2% SS and investment returns as a potential worst case scenario.
 
Back
Top Bottom