PSA: Interactive State Taxes Table

Midpack

Give me a museum and I'll fill it. (Picasso) Give me a forum ...
Joined
Jan 21, 2008
Messages
21,349
Location
NC
With relocation in the picture, I refer to several though most are "static" and therefore less useful. I thought this one was worth sharing as it:
  • includes state income, sales, property & gas taxes and
  • you can vary income, grocery, property value & miles driven
and it instantly recalculates and sorts. An example with one set of inputs below. I expected to see CA, NY, NJ, MA, CT to be the highest - not NE or some of the others near the top?

FWIW

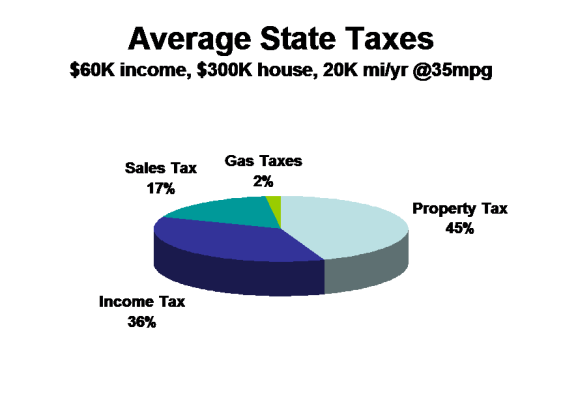
State Tax Comparison Table

RankStateTot Tax
1Nebraska$9,377
2Wisconsin$9,303
3Connecticut$8,370
4Vermont$8,321
5Kansas$8,204
6New Jersy$8,115
7Michigan$7,937
8Iowa$7,766
9Illinois$7,621
10New York$7,539
11Maine$7,528
12Washington, D.C.$7,432
13Minnesota$7,426
14Rhode Island$7,423
15Pennsylvania$7,341
16Idaho$7,197
17North Carolina$7,128
18Massachusetts$7,051
19Oregon$7,007
20Ohio$6,927
21Texas$6,610
22Kentucky$6,529
23North Dakota$6,490
24California$6,423
25South Carolina$6,357
26Georgia$6,244
27Indiana$6,231
28Virginia$6,200
29Missouri$6,162
30Utah$6,159
31Oklahoma$6,102
32Arkansas$6,044
33Montana$5,953
34Maryland$5,945
35Hawaii$5,823
36Mississippi$5,700
37West Virginia$5,664
38New Hampshire$5,118
39South Dakota$4,996
40New Mexico$4,808
41Colorado$4,753
42Arizona$4,424
43Alabama$4,326
44Delaware$4,115
45Washington$3,910
46Tennessee$3,856
47Florida$3,738
48Alaska$3,212
49Nevada$3,092
50Louisiana$2,916
51Wyoming$2,586
 
Last edited:
Interesting table.

I'd have to adjust some of the items, a bit, because of quirks of my state. Prop 13 impacts property taxes - taxing new owners much more than people who have lived in their homes longer. I'm not sure that table includes our latest tax increases... (EG Sales tax just went up 1/1/2013.)
 
Pretty interesting. I know this is just taxes but taxes are not the only cost that varies. Heating and cooling, Property cost.

The chart underestimates my property tax also.
 
Interesting table.

I'd have to adjust some of the items, a bit, because of quirks of my state. Prop 13 impacts property taxes - taxing new owners much more than people who have lived in their homes longer. I'm not sure that table includes our latest tax increases... (EG Sales tax just went up 1/1/2013.)
Lazarus said:
Pretty interesting. I know this is just taxes but taxes are not the only cost that varies. Heating and cooling, Property cost.

The chart underestimates my property tax also.
The blog author is open to input on rates, and provides a link to do so...
 
Looks like a dud thread (sorry), but I did an average for all states to confirm for myself at least that Prop Taxes are my biggest state expense, not Income Taxes. And Gas Taxes are pretty trivial.

Federal taxes are still larger than any single state tax, but considerably less than state taxes in the aggregate.
 

Attachments

  • ST.png
    ST.png
    8.7 KB · Views: 11
I appreciated the link and played with the imputs a bit as well as forwarding it. Alaska seemed to be the least expensive state * for taxes * but I suspect the other costs of living there more than make up for it. And as a friend last night said - the weather makes Alaska unattractive. My cheap genes keep wanting to move to Wyoming, and I've liked the people,but, again, weather.

Nevada is a possibility, but I just haven't had a good feel from the people in that state - maybe it's me, but there seems to be an underlying desperation there.

Comes down to it, and given Oregon will tax our rental income anyway, several thousands of dollars/year isn't enough to urge a move.
 
We pay 9.875% sales tax. The table only counts that as 4%, the part of that sales tax which goes to state and not local government.

So yes, it does show the state taxes, but it's not a good tax comparison for areas that have substantial local taxes. Our property taxes go to the Parish (=county), although it shows a small amount is included in the computations as well. Our state income tax is supposedly 6%, and they say it is 4%, but maybe that is after deductions and so on.

I think that to compare two locations being considered for retirement, one must look at the exact taxes in those locations. Local taxes may make a huge difference.
 
Last edited:
We pay 9.875% sales tax. The table only counts that as 4%, the part of that sales tax which goes to state and not local government.

So yes, it does show the state taxes, but it's not a good tax comparison for areas that have substantial local taxes. Our property taxes go to the Parish (=county), so I assume they are completely left out of the computations as well.
"In addition, in states marked with a dagger (†), additional municipal and regional sales taxes may apply. In states marked with a double dagger (‡), certain items may be taxed at a higher rate, sometimes substantially so." Though curiously LA is not marked :confused:

A tool that factored in local sales, income, property and/or gas taxes would probably be a lot to ask of a free tool, but your point is well taken. FWIW
 
"In addition, in states marked with a dagger (†), additional municipal and regional sales taxes may apply. In states marked with a double dagger (‡), certain items may be taxed at a higher rate, sometimes substantially so." Though curiously LA is not marked :confused:

That's my point. Imagine the shock of someone who actually believed this table and then moved here. :D Also, if any of my property tax goes to the state, then I was not aware of it. We vote locally on the millages and the math seems to work out. I guess it is always possible.

A tool that factored in local sales, income, property and/or gas taxes would probably be a lot to ask of a free tool, but your point is well taken. FWIW

Everything I ever look at on the internet is free. But this particular table is essentially useless for comparison purposes, for those like me living in areas with high local taxes. I just wanted to point that out, since I was surprised when I visited Missouri and did a more realistic comparison of taxes.
 
Last edited:
That's my point. Imagine the shock of someone who actually believed this table and then moved here. :D
I can't imagine anyone would...:D

W2R said:
Everything I ever look at on the internet is free. But this particular table is essentially useless for comparison purposes, for those like me living in areas with high local taxes. I just wanted to point that out, since I was surprised when I visited Missouri and did a more realistic comparison of taxes.
I would think it might be useful for initial screening, but sorry...you're most welcome to kill the thread, wouldn't bother me. I wasn't hoping to mislead or provide a useless link.
 
Last edited:
I can't imagine anyone would...:D

I would think it might be useful for initial screening, but sorry...you're most welcome to kill the thread, wouldn't bother me. I wasn't hoping to mislead or provide a useless link.

Not at all. You posted the link for discussion, and sometimes during discussion one sees two sides of an issue (or link, in this case) rather than universal praise for it. That's useful as well.
 
Thanks for link!
The assumption is clearly stated in the link, but it is helpful to call out. Property cost varies significantly and that changes the property tax paid. If the author used median home value, that might help make it more representative. Also a similar tax comparison of the major urban/cities areas would be nice :) As someone else pointed out, in CA newcomers pay the real rate (1% here) although median might be 0.5% because of existing owners.


NY, CA, etc will come out at the top when a real scenario is used.
 
Not at all. You posted the link for discussion, and sometimes during discussion one sees two sides of an issue (or link, in this case) rather than universal praise for it. That's useful as well.
Indeed, I'll leave it at that...
 
And, let's not forget that the author is (apparently) to suggestions. Perhaps the project will grow into a more complete form.

IMHO, Anytime you try to boil down a very complex issue like that into half a dozen inputs it gets really really difficult to provide any meaningful output. As always, YMMV
 
For Texas - FWIW, the property tax which is the largest tax we pay was 99.4% of what we actually paid this year. So the chart was extremely accurate.

This chart will become less accurate for those over 65 as it does not factor in the cap on school taxes for those 65 or over.

The sales tax rate was accurate as far as it goes - 6.25% but we actually pay 8.25% in most areas due to local taxes. The fact there might be local taxes was noted.
 
Looks like this was developed almost three years ago and hasn't been touched since then. The accompanying blogs last entry was September 2010.

It is a great idea to bad it seems to have been abandoned.
 
For you Illini........

Note the tool uses 3% for Illinois income tax and this has been increased 67% to 5%. Likely, it will increase quite a bit more...... or Illinois will simply go out of business.
 
Any of you have a better interactive resource by any chance? I've seen lots of the static tables & maps, though at least they're more current.
 
Interesting. I plugged in my actual state taxable income for 2012 and my assessed value and the sum of state income taxes and property taxes was ~97% of the actual amounts.

As W2R noted, ignores some local taxes, but in my case, pretty close.
 
Thanks for the link!
As has been said, many individual variables but it is good place to start.
 
I like this link! My income tax is notably higher than my property tax...and our guv has just announced plans to increase the income tax by 19%.

The site does not take into account excise, estate, liquor, meals and other state taxes but does give a good windage on things.

Moving 40 miles north to NH would save me about $12K a year I think.
 
Our pensions are fully taxed at Federal, state, and county levels, so moving to a state that either has no income tax, or doesn't tax pension income, is a very attractive idea to us.

Interestingly, these types of articles/tables never mention that NC doesn't tax Federal or military pensions or SS, due to the legislation known as the "Bailey decision."

Amethyst
 
General taxing information is almost meaningless because of all the variables. You almost have to pick an exact location you would like to move too, and find exact costs to compare to current situation. I live in MO which has a 6% income tax over 9k of income. Since including my PT job, I am about
100k last year. I originally thought if I moved to an non state income tax state, I would save close to six thousand bucks. Well, not true. Thanks to a provision of pension income being excluded, my state taxes were less than $1700, or only 1.7% total.
 
Back
Top Bottom