Stock returns during great depression ??

David1961

Thinks s/he gets paid by the post
Joined
Jul 26, 2007
Messages
1,085
I’ve been trying to do some research on the stock market returns during and after the great depression, and cannot find certain information. I know there were not index funds (or even mutual funds) available back then, and in many ways, it may be like comparing apples to oranges. My question is this: suppose at the start of the market crash if 1929, a person held a certain dollar amount (let’s say $10,000 which would have been an enormous amount of money back then) in the stock market and suppose this was invested in a vehicle similar to an S&P 500 index fund today. If the money was left in this fund, having all distributions reinvested, how long would it have taken to recover the losses? (at what point would the value have come back to $10,000). And also, at what point would the investor have the same buying power he/she had before the crash (which considers inflation). According to some web sites, the total decline by 1923 was somewhere around 75% to 90% of the original value before the crash. But I cannot find out how long it would have taken to “break even” points. Can anyone point me to where I can find this information? Thanks.
 
Not sure where you can find specific details on your question but looking at the DOW chart it appears it took until about 1955 to recover the losses.
True, but if you include reinvested dividends, it would have taken only until 1944. With stock levels so depressed, dividend yields were rather high.
 
i checked my 1999 edition of "Common Sense on Mutual Funds" by John Bogle to refresh my memory on what types of historical charts he put in there. Mr. Bogle is very big on using real data to drive home his most excellent points of discussion. i would suggest asking this at the Bogleheads site, maybe? these folks would know exactly where it find this current data.
 
I know there were not index funds (or even mutual funds) available back then

There were mutual funds back then. The executed concept of mutual funds goes back to the 1800's, and a number of open public MF's were available for several years before the Depression. Some are still operating today, such as
Vanguard Wellington, Massachusetts Investors Trust, Pioneer, Putnam (Incorporated) Investors, State Street Research Investment, Scudder Income (Balanced), CGM (Loomis Sayles) Mutual, Century Shares Trust, and Seligman (Broad Street) Stock.

Many of these have historical data charts running from 1920-something to present. None of them are index funds, however and many were not pure stock funds but rather balanced funds.

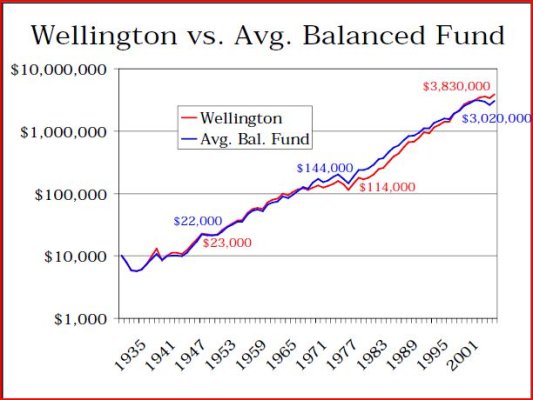
The largest and perhaps best example is Vanguards Wellington:
 

Attachments

  • wellington historical.JPG
    wellington historical.JPG
    54.5 KB · Views: 8
There were mutual funds back then. The executed concept of mutual funds goes back to the 1800's, and a number of open public MF's were available for several years before the Depression. Some are still operating today, such as
Vanguard Wellington, Massachusetts Investors Trust, Pioneer, Putnam (Incorporated) Investors, State Street Research Investment, Scudder Income (Balanced), CGM (Loomis Sayles) Mutual, Century Shares Trust, and Seligman (Broad Street) Stock.

Many of these have historical data charts running from 1920-something to present. None of them are index funds, however and many were not pure stock funds but rather balanced funds.

The largest and perhaps best example is Vanguards Wellington:


I did not know that. Thanks for sharing.
 
Interesting to note that from its inception to the early-mid 50's, Wellington averaged between 40 and 50% equities, some cash and the rest in bonds. After that it was ~60-70% equities.

So for its first 25-30 years, its asset allocation was a lot closer to the companion Wellesley fund (inception: 1970) than its current incarnation.

Its also worth noting that it has generally been a "value" investment fund, buying primarily cheaply valued stocks that paid a good dividend.

So the 40/60-60/40 blend, focused on value and dividends, balanced with good quality bonds and cash weathered the depression rather well and recovered its value in <10 years.
 
Its also worth noting that it has generally been a "value" investment fund, buying primarily cheaply valued stocks that paid a good dividend.

Except for the 60s + 70s when Bogle went and screwed things up. :rant:
 
I’ve been trying to do some research on the stock market returns during and after the great depression, and cannot find certain information. I know there were not index funds (or even mutual funds) available back then, and in many ways, it may be like comparing apples to oranges. My question is this: suppose at the start of the market crash if 1929, a person held a certain dollar amount (let’s say $10,000 which would have been an enormous amount of money back then) in the stock market and suppose this was invested in a vehicle similar to an S&P 500 index fund today. If the money was left in this fund, having all distributions reinvested, how long would it have taken to recover the losses? (at what point would the value have come back to $10,000). And also, at what point would the investor have the same buying power he/she had before the crash (which considers inflation). According to some web sites, the total decline by 1923 was somewhere around 75% to 90% of the original value before the crash. But I cannot find out how long it would have taken to “break even” points. Can anyone point me to where I can find this information? Thanks.

David,

One of my interest finance buddies [richard], put together this shttp://www.geocities.com/alec_stanley/Richardsreturns.xlspreadsheet [moderator edit - copyright issue] that calculates nominal and real returns [see the "annual" worksheeet]. Just enter the two year dates in the yellow boxes. Looks like you did not recover in inflation adjusted terms until 1936.

- Alec
 
http://www.stockcharts.com/charts/historical/images/djia1900s.png


It all depends on when you invested. If you had done so in 1929, then with hindsight we can say that you had the misfortune of investing at the peak of a spectacular bull market. From 1924-1929 the DOW went from around 100 to 380.

Had you invested 5 years earlier in 1924 you would be breaking even on a nominal basis by 1934 whereas your 1929 counterpart would take until 1955 to recover. (just from DOW chart, no dividends/inflation/deflation considered)

My brother-in-law and I were discussing that tonight. In theory you are correct if you bought the index. However, if you happened to be in the one of the many companies that went out of business, you had no investments left with which to recover during the recovery.
 
One of my interest finance buddies [richard], put together this http://www.geocities.com/alec_stanley/Richardsreturns.xlsspreadsheet that calculates nominal and real returns [see the "annual" worksheeet]. Just enter the two year dates in the yellow boxes. Looks like you did not recover in inflation adjusted terms until 1936.

- Alec

Alec,

Thanks for the spreadsheet. I think it is a really great tool!
Thank Richard for me, too.

Free to Canoe
 
David,

One of my interest finance buddies [richard], put together this spreadsheet that calculates nominal and real returns [see the "annual" worksheeet]. Just enter the two year dates in the yellow boxes. Looks like you did not recover in inflation adjusted terms until 1936.

- Alec

Alec, Could you tell me what the headings on the data pages mean? That sheet represents an amazing amount of work.

ha
 
I think there is a fundamental difference between the depression and now. People were not willing to take risk, and they were not so greedy and needy as today in the 40's.

Once the market recovers all the greed will come back in a few years and drive the markets higher. People will search for a higher standard of living and bet it all again.

In the 40's people just went to cash. You could live like that then, but not now. Cash won’t get you a retirement or any toys. People will bet it all again.
 
Alec, Could you tell me what the headings on the data pages mean? That sheet represents an amazing amount of work.

ha

The CRSP indices come from the Center for Research in Security Prices. This is where Fama & French get their stock data for their research.

Short version [i.e. my understanding] is that the CRSP divides the US equity universe into deciles [meaning there are 10 of them], with each decile have the same market cap but different number of stocks. For example, decile 1 would have say 75 stocks while decile 10 would have say 1000 stocks. Anyway, deciles 1-5 are large caps, deciles 6-10 are the small caps, and deciles 6-8 are small caps without micro caps, deciles 9-10 are micro caps, and deciles 1-10 is the Total market portfolio.

The use of deciles for their small cap and micro cap funds is why the DFA small and micro funds usually have smaller market caps than the small cap index funds tracking indices from Russell, S&P, or MSCI.

- Alec
 
According to the Schiller data is was (as ziggy said) late 1944 that you recovered from Sept 1929 on an inflation adjusted basis with dividends reinvested.

BTW the worst your $100 would have looked is an inflation-adjusted $14 in mid 1932.
 
Back
Top Bottom