Well, if I were a betting man, I'd bet that roughly half were beating the index
")
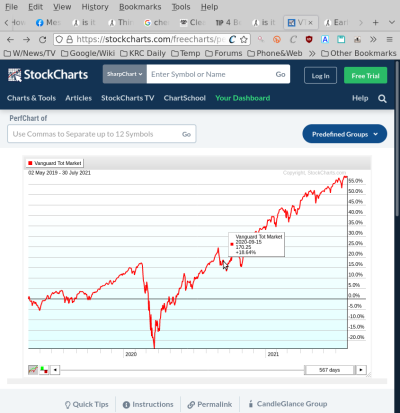
Thanks, looks like you were really leaving the index in the dust. I see a little over 18% gain for VTI using this tool:
https://stockcharts.com/freecharts/perf.php?VTI
So you were at $141K vs ~ $118K for VTI. Nice.
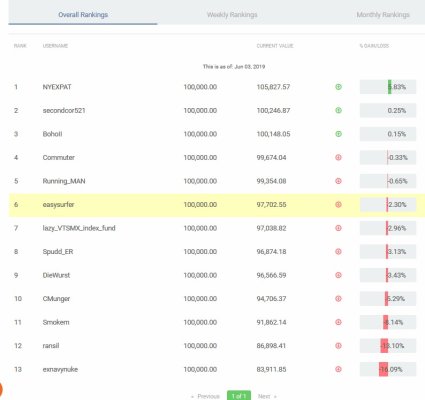
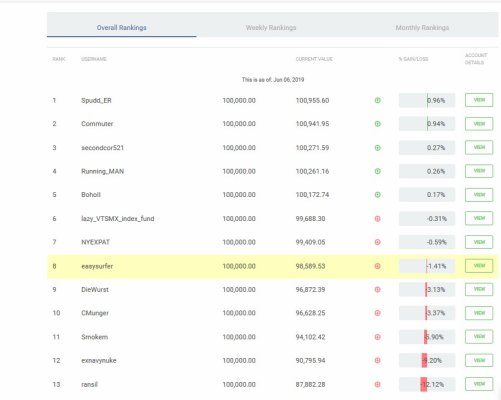
Running_Man was lagging at this point, ~ $109.5K vs the $118K for VTI.
Interesting. I guess
NYEXPAT doesn't consider VTI "competition"? I do!
I really wanted to see how some of these traders did against VTI. Wish I had followed the thread closer, maybe I could have taunted some of them into staying active
edit/add: So I see that NYEXPAT says he quit in early JUNE2020, the last screenshot you have of him is from February 19, 2020, and there he is in the red over 9%, while VTI was up over 17%. No competition?
-ERD50