Wellesley Fund

? capital gains distributions

A bit off topic, but I think I see the hypothetical 200K in Wellesley and Wellington would have distributed about 12000$ in capital gains and actually ended the year down a couple thousand.

Is there any predictability to capital gains distributions? i.e. what has been the range over the last 10 years?

If you "spend" all the capital gains distributions and dividends has the "principal" kept up with inflation?

I know the past does not predict the future, but trying to figure out how one would "manage" this "set it and forget it" portfolio during distribution times (i.e. they need the income/distributions)

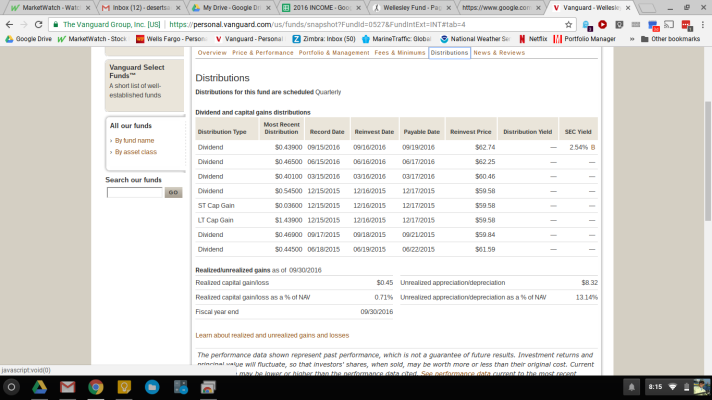
If you look at unrealized gains, you can maybe guess the highest amount of CG.

Screenshot 2016-10-26 at 8.15.48 AM.png
 
I don't remember how I did it but a couple of years ago someone on this forum told me how to download fund distributions from Vanguard. Here's what I got at the time going back 10 years; one thing to note is the lack of CG distributions from 2008-2011:

Wellington Fund Admiral Shares (VWENX)
Type $/Share Payable date Reinvest price
Income $0.50 12/29/2014 $68.15
Short-Term Capital Gain $0.35 12/29/2014 $68.15
Long-Term Capital Gain $2.25 12/29/2014 $68.15
Income $0.43 9/22/2014 $69.48
Income $0.42 6/23/2014 $68.95
Income $0.43 3/31/2014 $66.28
Income $0.47 12/27/2013 $65.31
Short-Term Capital Gain $0.40 12/27/2013 $65.31
Long-Term Capital Gain $2.26 12/27/2013 $65.31
Income $0.41 9/27/2013 $64.96
Income $0.43 6/28/2013 $62.88
Income $0.38 3/28/2013 $62.04
Income $0.48 12/31/2012 $58.00
Short-Term Capital Gain $0.14 12/31/2012 $58.00
Long-Term Capital Gain $0.62 12/31/2012 $58.00
Income $0.40 9/28/2012 $59.27
Income $0.43 6/29/2012 $55.93
Income $0.40 3/30/2012 $57.65
Income $0.46 12/28/2011 $54.12
Income $0.42 9/30/2011 $51.14
Income $0.43 6/30/2011 $55.29
Income $0.36 3/31/2011 $55.69
Income $0.39 12/29/2010 $53.46
Income $0.37 9/28/2010 $51.19
Income $0.41 6/29/2010 $48.52
Income $0.35 3/30/2010 $51.38
Income $0.44 12/29/2009 $50.06
Income $0.37 9/29/2009 $48.32
Income $0.43 6/26/2009 $43.51
Income $0.36 3/27/2009 $39.96
Income $0.49 12/29/2008 $41.15
Income $0.45 9/26/2008 $49.34
Income $0.50 6/27/2008 $52.27
Income $0.41 3/28/2008 $53.70
Income $0.59 12/28/2007 $56.36
Short-Term Capital Gain $0.21 12/28/2007 $56.36
Long-Term Capital Gain $2.25 12/28/2007 $56.36
Income $0.47 9/24/2007 $59.73
Income $0.48 6/25/2007 $58.22
Income $0.40 3/26/2007 $56.45
Income $0.50 12/27/2006 $55.99
Short-Term Capital Gain $0.23 12/27/2006 $55.99
Long-Term Capital Gain $2.19 12/27/2006 $55.99
Income $0.43 9/25/2006 $55.24
Income $0.45 6/26/2006 $52.57
Income $0.38 3/27/2006 $54.05
Income $0.51 12/29/2005 $52.66
Short-Term Capital Gain $0.11 12/29/2005 $52.66
Long-Term Capital Gain $1.57 12/29/2005 $52.66
Income $0.39 9/26/2005 $53.45
Income $0.38 6/27/2005 $52.08
Income $0.36 3/28/2005 $51.27
 
Ooops, that was for Wellington. Here's Wellesely (also a lack of CG distributions from 2009-2011):

Wellesley Income Fund Admiral Shares (VWIAX)
Type $/Share Payable date Reinvest price
Income $0.54 12/18/2014 $61.39
Short-Term Capital Gain $0.06 12/18/2014 $61.39
Long-Term Capital Gain $1.04 12/18/2014 $61.39
Income $0.46 9/22/2014 $62.57
Income $0.45 6/23/2014 $62.77
Income $0.55 3/31/2014 $61.05
Income $0.51 12/18/2013 $59.45
Short-Term Capital Gain $0.11 12/18/2013 $59.45
Long-Term Capital Gain $1.53 12/18/2013 $59.45
Income $0.45 9/27/2013 $60.34
Income $0.49 6/28/2013 $59.55
Income $0.43 3/28/2013 $60.21
Income $0.50 12/18/2012 $58.45
Short-Term Capital Gain $0.01 12/18/2012 $58.45
Long-Term Capital Gain $0.81 12/18/2012 $58.45
Income $0.45 9/28/2012 $59.36
Income $0.49 6/29/2012 $57.11
Income $0.47 3/30/2012 $57.15
Income $0.54 12/19/2011 $54.71
Income $0.50 9/30/2011 $53.07
Income $0.51 6/30/2011 $54.07
Income $0.47 3/31/2011 $53.61
Income $0.54 12/17/2010 $52.00
Income $0.48 9/28/2010 $52.32
Income $0.50 6/29/2010 $49.67
Income $0.47 3/30/2010 $50.22
Income $0.59 12/22/2009 $49.37
Income $0.50 9/29/2009 $48.48
Income $0.54 6/26/2009 $44.33
Income $0.58 3/27/2009 $41.63
Income $0.65 12/17/2008 $43.98
Long-Term Capital Gain $0.78 12/17/2008 $43.98
Income $0.59 9/26/2008 $48.16
Income $0.62 6/27/2008 $49.27
Income $0.57 3/28/2008 $51.18
Income $0.69 12/14/2007 $52.93
Long-Term Capital Gain $0.63 12/14/2007 $52.93
Income $0.57 9/24/2007 $53.98
Income $0.57 6/25/2007 $52.94
Income $0.50 3/26/2007 $53.49
Income $0.66 12/18/2006 $52.94
Short-Term Capital Gain $0.09 12/18/2006 $52.94
Long-Term Capital Gain $1.54 12/18/2006 $52.94
Income $0.57 9/25/2006 $53.05
Income $0.55 6/26/2006 $50.36
Income $0.50 3/27/2006 $51.61
Income $0.63 12/19/2005 $51.17
Short-Term Capital Gain $0.02 12/19/2005 $51.17
Long-Term Capital Gain $0.91 12/19/2005 $51.17
Income $0.54 9/26/2005 $52.44
Income $0.52 6/27/2005 $52.67
Income $0.47 3/28/2005 $51.34
 
I would think being a US citizen is good enough to keep your IRA open and active regardless of where you live, but not with VG. Fidelity lets you trade within your IRA as long as you already had an IRA with them before your move. (You evidently cannot open new ones.) Policies seem much more open for UK and MX residents. Something about Canada that makes it more difficult.

VG has no restrictions on trading for UK residents who are already account holders, but you cannot open new accounts without a US residential address. Charles Schwab is a pretty good provider for US expatriates.
 
Back
Top Bottom