Originally Posted by mathjak107 View Post
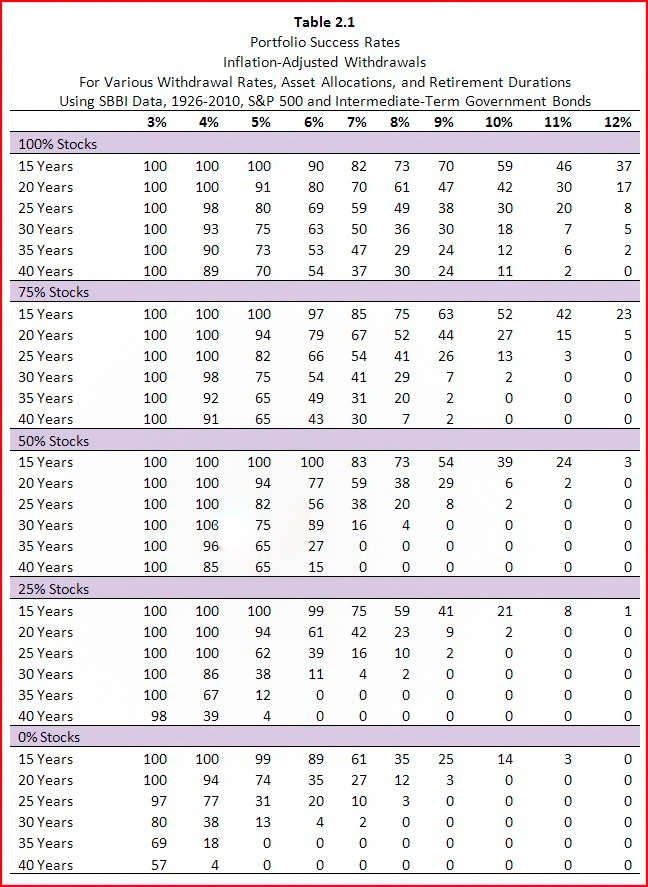
what is missing from the statistics of the chart is the interplay with the statistics of life expectancy .
most of us will not see 30 years in retirement so that boosts success rate since less years will statistically be needed so higher draw rates are really still safe when you play with statistics and success rates . a 90% success rate can become 97% when life expectancy is considered .
I think there is a major flaw in that logic, and I see it a lot on this board.
No one here would, by choice, go with a plan with a 50% chance of success. It's too risky.
Yet you want to base your plan on life expectancy, which you have a 50% chance of exceeding. So your 97% success rate you quote only works 50% of the time. You've got a lower success rate for the other 50%. It makes no sense to me to plan on all but the very worst cases with the market, but only for average life span rather than a nearly "worst" case scenario of living long.
....
I know someone is going to read this and scoff at me for thinking I'll live to 95, but that's not at all what I'm saying. I'm planning
in case I live to 95. Again, planning for worst case, not average case.

") ) :
) :