2015 YTD investment performance thread

2015 Performance: 1.06 % Investment Return

71% Equity (59/12 Domestic/International)
0% Bond
29% Cash (mostly CD's with weighted APR=4%))


Crap! What did I do wrong?
I am scared of bonds and bond funds for all the reasons discussed. I have CDs instead but I am thinking of drawing an arbitrary line at 2yrs and calling anything with more than 2 yrs remaining a "bond". If do that, my cash allocation would be about 15%


5


Dont feel bad, Jazz, I am scared of both bonds and common stocks, so I own neither. I have almost all my money in preferred stocks of mostly investment grade issues yielding between 6-7%.
Everyone needs to do their own due diligence and what feels comfortable to them, but when I am getting 400 BP's above 10 year and 500 above inflation, in a sluggish little growth, little inflation, do nothing economy this is when they shine. I returned almost 9% last year with little risk and no volatility.
Today is a perfect example.... 7 issues up, 2 down, and 7 unchanged. With stocks and bonds both valued richly, snagging yield trapped past call preferreds with high quality companies disinterested in calling them is a nice play. Many will call their 4-5 % senior debt to reissue, but leave the low hanging high yield fruit to pick. Its been easy money for me anyways. Of course you need to have to be willing to research and prefer income to "TR". It isn't everyones cup of tea, but it works for me.


Sent from my iPad using Tapatalk
Yes, I've been following the Preferred Stock thread and appreciate the contributions from you and others. Provided I have sufficient patience, I am very interested in making room in my portfolio for a few of these after I gain some more confidence.
 
I finally looked and it's actually close to 6%, my husband account was more than 5%. If I can believe what I read.


Sent from my iPad using Early Retirement Forum
 
Did I read that right? I looked up the Fundx upgrader fund and on their web page gross expense fee 1.99% Yahoo says the same.

I did not make myself clear. I construct my own equity portfolio by following the recommendations of Fundex through their newsletter. (Monthly Upgrader Portfolio) I wouldn’t touch their mutual funds because of the high fees. This has served me well to the tune of about 400 basis points over my index portfolio for the past two years.
 
According to an article on marketwatch.com, the average investor lost 3.1% in 2015. Looks like my 100% cash portfolio did better than most in 2015 and also 2016 YTD.


This is how much the average American investor made last year - MarketWatch

Don't you think that's unscientific and possibly misleading? I expect lots of people, dare I say "most Americans", did not share their information on that site.

Quoting from the article

"But, judging from this Visual Capitalist chart based on data collected by Openfolio, a site on which investors share information about themselves and their investments, most Americans didn’t meet that low threshold. Only one-third of investors made money on the year, according to Openfolio, and the average American lost 3.1%. "

I would agree that it's not accurate to 2 decimal points but the results are consistent with what I've read and heard - low single digit losses. I met with a wealth manager in early December who told me his performance YTD was -3% and that is consistent with the chart. I realize that is only one data point but that along with other results I follow suggest it's in the ballpark. Considering the S&P500 (without dividends) ended negative for the year and most emerging market funds also ended negative in 2015, I'd say low single digit loses is probably correct. We'll know more once the results of various active and passive funds are published in the next month or two. Median data would be more useful since averages can be skewed by outliers.
 
*************************
Investments (w/o operating cash)

+4.50% - 2015 total balance
-1.60% - 2015 total performance
*************************

Unexpected earned income helped quite a bit.
 
I would agree that it's not accurate to 2 decimal points but the results are consistent with what I've read and heard - low single digit losses. I met with a wealth manager in early December who told me his performance YTD was -3% and that is consistent with the chart. I realize that is only one data point but that along with other results I follow suggest it's in the ballpark. Considering the S&P500 (without dividends) ended negative for the year and most emerging market funds also ended negative in 2015, I'd say low single digit loses is probably correct. We'll know more once the results of various active and passive funds are published in the next month or two. Median data would be more useful since averages can be skewed by outliers.

You are probably right about the results. There is a large body of evidence that says the average investor does significantly worse (3-4%) than the average US stock market returns. What I was questioning was the data source and drawing conclusions from that.
 
Finally, I have enough data to be able to contribute to this thread. STLYX* returned 0.27% in 2015.

Since I'm the kind of guy who always wants to get right to the swimsuit competition, here's what it's got:

Ticker​
FSTVXTotal Market Index7.387.41
FSEVXExtended Market Index19.5718.23
FCNTXContrafund18.4217.12
FSIVXInternational Index13.1212.25
FEMKXEmerging Markets6.696.14
FSITXUS Bond Index14.7317.11
FINPXInflation-Protected Bond4.905.88
FAGIXCapitol & Income2.482.87
FNMIXNew Markets Income2.532.90
FRESXReal Estate Investment10.1810.09
[TD]Name[/TD][TD]2015 %[/TD][TD]2016 %[/TD]​

[TR][TD][/TD][/TR]
[TR][TD]​
[/TD][/TR]
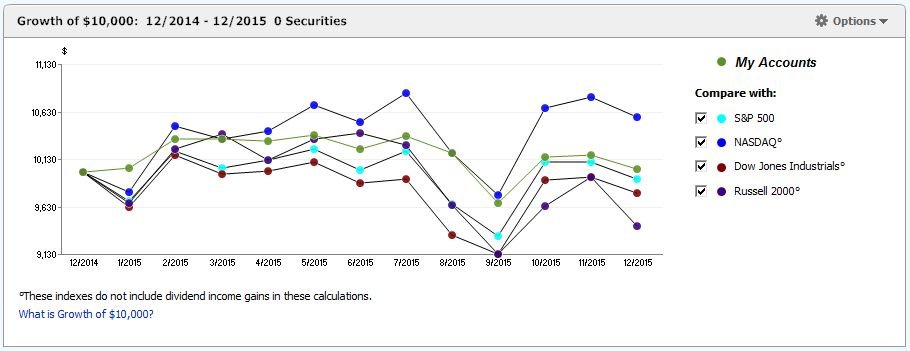
Attached is a Quicken-generated graph that shows STLYX* return (Growth of $10,000) vs. various market indexes in 2015. The reason why it's dated from 12/14-12/15 is that Quicken seems to want to plot its points at month-end, so if I start from January 2015, it misses the required distribution that I have withdrawn automatically as early as possible each year (because the point would be January 31), so this graph begins December 31, 2014.

Background: this is not my full portfolio, but an inherited IRA that came into existence in early 2013. That makes it super-easy to track returns, since there is a known starting date/value, no additions, only the IRS-required distributions each year.

I started calling it STLYX (to amuse myself, mainly), but then discovered that ticker was already taken by a (much more boring) fund, so I decided to do what they did for Roger Maris and add the asterisk.

I like several things about the pattern shown in the $10K graph, not the least of which is that STLYX* didn't take quite the nosedive as the indexes in August and September (remember that? Wasn't that China-induced also?). If that kind of pattern were to persist for the balance of my retirement (highly unlikely), I'd call it fine with me.

STLYX* is steered by the top-level stock/bond allocation determined by Vanguard's 2025 target-date fund (VTTVX, which returned -0.85% in 2015). I decided to let the "pros" dictate that split and chose Vanguard due to a comparison of similar funds a while ago. Instead of dumping it into VTTVX, I dollar-cost averaged all the initial cash over a period of two years, which ended with investing the final chunk of cash in early February 2015. Although I follow a Vanguard top-level allocation, I implement it using Fidelity fund choices that I picked, most of which I am familiar with through my former employer-sponsored retirement plans. It's not a vote for or against either, I have a separate Roth in Vanguard that's great.

Starting with the VTTVX stock/bond allocation, I subtract 5% off the top of both (10% total) and give that over to real estate, and the reason for that is from reading what I think is an excellent book: Burton Malkiel's A Random Walk Down Wall Street (one of e-r.org's recommended reading list), in which he suggests treating real estate as a separate asset class.

Additional data from Morningstar's Porfolio X-Ray tool regarding STLYX*: the overall exoense ratio is 0.37% and the top 5 individual stock holdings (in order) are FB, AAPL, PSA, BRK.A, and SPG (as of 11/30/15).

That's my contribution to this thread for 2015. I only know a few things with certainty about 2016: first, I haven't the slightest idea what any of the returns will look like in 2016; second, I'm all done with messing with STLYX* for the rest of the year as I've received the distribution and have rebalanced to the percentages shown in the table so now I can spend the rest of the year getting more practice with the thing called early retirement; and third, the probability of me turning into a Market Timing Winged Monkey = zero. :LOL:

One more thing: I got a Wait, Wait... question: what fund (that I don't own) returned 1.35% in 2015? Hint: "Pssst...."
 

Attachments

  • Growth10K-2015.JPG
    Growth10K-2015.JPG
    53.6 KB · Views: 19
Last edited:
Finally, I have enough data to be able to contribute to this thread. STLYX* returned 0.27% in 2015.

Since I'm the kind of guy who always wants to get right to the swimsuit competition, here's what it's got:

Ticker​
FSTVXTotal Market Index7.387.41
FSEVXExtended Market Index19.5718.23
FCNTXContrafund18.4217.12
FSIVXInternational Index13.1212.25
FEMKXEmerging Markets6.696.14
FSITXUS Bond Index14.7317.11
FINPXInflation-Protected Bond4.905.88
FAGIXCapitol & Income2.482.87
FNMIXNew Markets Income2.532.90
FRESXReal Estate Investment10.1810.09
[TD]Name[/TD][TD]2015 %[/TD][TD]2016 %[/TD]​

[TR][TD][/TD][/TR]
[TR][TD]​
[/TD][/TR]

Sorry but I think you need to re-check those calculations. I looked up the NAV on yahoo finance and it says the NAV on 12/31/15 FSTVX=58.67, FSEVX=50.2, NAV on 12/31/14 FSTVX=59.87, FSEVX=55.18 so both funds had negative returns in 2015 before dividends. FSTVX paid dividends of 1.45 and FSEVX paid dividends of 3.17. Including dividends FSTVX was barely positive for the year and FSEVX returned -3% in 2015.
 
Sorry but I think you need to re-check those calculations. I looked up the NAV on yahoo finance and it says the NAV on 12/31/15 FSTVX=58.67, FSEVX=50.2, NAV on 12/31/14 FSTVX=59.87, FSEVX=55.18 so both funds had negative returns in 2015 before dividends. FSTVX paid dividends of 1.45 and FSEVX paid dividends of 3.17. Including dividends FSTVX was barely positive for the year and FSEVX returned -3% in 2015.

There's no need to be sorry. Those are percentages of each fund contained within the portfolio in 2015 and 2016.
 
Last edited:
My mistake. Note to self: Re-read posts carefully before replying. :facepalm:


:)

S'ok. That's a lotta numbers up there, one reason I don't do it often. But I think it's good to try to be complete and transparent if possible.

A 0.27% return is hardly something for anyone to be flapping their wings about but hey, if ya gonna talk the talk...

Now I think it's good to watch those NFL playoffs. The thing called ER!
 
Last edited:
Buried amidst the screeching of the Market Timing Winged Monkeys lately (or if someone posted, I missed it) was the announcement from the BLS that the CPI-U less food and energy for the 12 months ended December 2015 was 2.1%.

Occasionally people ask what numbers others use for planning purposes for returns in their ER planning spreadsheets (you know, the ones that just keep growing every time you think, "Oh wait! But what about THAT?"). In my case, I used 7% nominal return while still working and 6% afterwards. For both, I factored 3% inflation. So, to use a sports metaphor, I hoped (but as a wise man sang, "you can't always get what you want") to sink a three-point shot (real) annually. But, looking from a nominal return perspective, it bounced off the rim in 2015 (if the nominal return were negative, then I'd figure I missed the barn completely).
 
Back
Top Bottom