How Long Did it Take Your Investment Portfolio to Rebound from Great Recession?

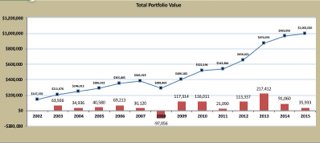
I do net worth accounting roughly twice a year. From a peak of 12/31/2007, I exceeded my net worth sometime between 1/1/2011 and 5/15/2011 so call it 39 months.
 
Comparisons in that timeframe are a little murky for me because I ERed in late 2008 as the markets were tanking. But here is a timeline of the downs and ups during the recession of 2008-09.


When I was working (but only 12 hours a week) in 2007, my total portfolio peaked in September, 2007 at about $975k, just missing $1M. However, at the time I kept track of my non-retirement account on a monthly basis but I kept track of my IRA on a quarterly basis because that's how often I received the 401k statements. Also, I recorded my non-retirement account balances in the middle of the month so there was never a time the two parts of my portfolio coincided.


For the next 12 months, the 401k's balance remained fairly stable due to the exploding value of the company stock (ESOP) in the account offsetting the drop in everything else (About a 55/45 AA in favor of stocks). The taxable part in that same time (also about 55/45 in favor of stocks) dropped a little more than 20%.


At the end of October, 2008, I did a direct rollover of the 401k into an IRA but cashed out the company stock and bought into a bond fund at dirt-cheap prices. I went from adding outside money from my job, albeit not a large amount, to withdrawing from it to cover my expenses in my much desired ER.


With the portfolio dropping anyway, I also paid some of the estimated tax bills in December and January (2009) to avoid underwithholding penalties. This further dropped the overall value of my portfolio to its low ($795k) in March, 2009.


But the portfolio rebounded very quickly in the next few months. Despite paying the rest of my income taxes (about $48k) due to the cash-out of the ESOP, and having a more bond-oriented portfolio, by June of 2009 it had bounced back to $850k. By September I was up to $920k. By March of 2010, I was up to $985k, more than what I had in late 2007. The rest of 2010 was a rocky ride but by the end of the year I was over $1M for good.
 
... I used Vanguard 500 Index Fund Admiral Class (MUTF:VFIAX) as a representative stock index fund. It looks like it reached a high around 10/07 at 143.9. The fund value did not reach that amount again until about 3/13 when at hit 144.4.

Does that mean that it took about 5 years and 5 months for the market to recover? ...

You need to add back all distributions to get a more real-life picture of the recovery...

OK, leave it to me again to do the dirty work.

I look at VFINX, Vanguard S&P index fund, to get performance with all dividends reinvested. Its high on 10/12/2007 was reached again on 8/31/2012. That's 1785 days, or 4 years, 10 months, 19 days. That's 6 months shorter, when dividends were included.

Edit: I think some folks reported peak-to-peak while others reported bottom-to-peak.

The OP used peak-to-peak, as noted above.

Now, if one has some bonds or cash, and does rebalancing, he will recover faster. Of course that depends on the execution, and some luck.

Here's what Wellesley and Wellington MFs did.

Wellesley: 10/26/2007 to 9/18/2009, 693 days or 1 year, 11 months.

Wellington: 10/12/2007 to 10/22/2010, 1106 days or 3 years.

The deeper the hole one falls into, the longer it takes to climb out. I am still surprised at the difference between 60/40 and 40/60 AA between the two funds.
 
Last edited:
Those were the days. Fond memories. I had some cash and managed to buy 800 shares of SPY for $74! That helped quite a bit.

I wonder how long it will be before the oil service companies come out of the current great oil recession? Seadrill needs to get back to $40 or so...
 
High was July 2008, and recovered that high in July 2009. The decline was 20% overall.

We were contributing heavily to 401K and 403B stock index funds, so the ride back up was enjoyable. Without contributions, it would have taken another year or two to climb back up. Good lesson for the future.
 
Peak to full recovery was 8 quarters, with the intermediate low in March 09 at -13%. I continued to contribute the whole time. Didn't do any buying or selling as I recall, other than the regular contributions.
 
Turbulent times are good teachers. Was in a heavy accumulation phase at the time (still am) so despite market losses, May 2008 was a peak, March 2009 was a bottom, and December 2009 was full account balance recovery on a 60/40 portfolio. Of course, recovery was more due to contributions than market performance. On market alone, my full recovery was sometime in 2011.
 
This is an update to include the loss at the bottom of the benchmarks. As can be expected, the higher the stock AA, the deeper the loss, the longer the recovery.

VFIAX (100% stock): 5 years, loss -55%
VWENX (60% stock): 3 years, loss -35%
VWIAX (40% stock): 2 years, loss -20%

Me (variable, 40% to 80% stock): 3 years, loss -37%

Considering that I was having a small net withdrawal, plus an initial high stock AA, I didn't do too badly.

If one looks at the stock market shape around the deep notch on 3/2009, one will see that it is a deep V shape, with broad shoulders. The S&P peaked out 16 months before that notch. Then, when it recovered, it was skimming the break-even line for several months before encroaching it.

So, if one was in an accumulating phase, fresh money invested would push his peak portfolio a lot closer to the notch, then pull it in a lot sooner during the recovery. And if one is in the withdrawal phase, his entire curve is slanted downward, and the two even points will stretch out to many more years. All that is evident in the results that posters reported.

When the next big drop comes, I will be fully in withdrawal phase and it will take a lot longer to see that money coming back, if at all. And it is going to be much more painful to throw money at the stocks that keep sinking into an apparent abyss.

It ain't easy.
 
Our portfolio topped its previous all time high in August, 2009, but that included additional savings that offset a modest net investment loss from the previous peak. The market continued up from there, and I did some calculations in December, 2009, that indicated we had already achieved a net profit on our investments.
 
Going back through our records I see:

10/31/07 - local peak at 670k
3/10/09 - hit bottom at 490k
7/31/09 - back to peak at 670k

I was working at the time so this includes new money going in.

When the next big drop comes, I will be fully in withdrawal phase and it will take a lot longer to see that money coming back, if at all. And it is going to be much more painful to throw money at the stocks that keep sinking into an apparent abyss.

This is my concern as well. I often see people asking how one handled the 2009 recession to determine risk tolerance, but I'm worried that without work income that it will be emotionally much more difficult to handle.
 
ER'd December 2002. No pensions, living from portfolio withdrawals. Peak pre recession portfolio value was in October 2007 and it took until December 2010 to regain that level. Nominal 50/50 with wide 10% rebalance band.
 
... I often see people asking how one handled the 2009 recession to determine risk tolerance, but I'm worried that without work income that it will be emotionally much more difficult to handle.

Let's look at the S&P from top in 10/2007 to bottom in 3/2009. Your $1 became 46 cents. What if the next time it will stay down there for a few years or a decade, as it had done before? And for young ER's living off their stash, and who are still a decade or two from SS? Buy, buy, buy? With what money?

Heh heh heh...


ER'd December 2002. No pensions, living from portfolio withdrawals. Peak pre recession portfolio value was in October 2007 and it took until December 2010 to regain that level. Nominal 50/50 with wide 10% rebalance band.

Not shabby at all. I am impressed. May I ask about your WR?
 
Last edited:
This is an update to include the loss at the bottom of the benchmarks. As can be expected, the higher the stock AA, the deeper the loss, the longer the recovery.

VFIAX (100% stock): 5 years, loss -55%
VWENX (60% stock): 3 years, loss -35%
VWIAX (40% stock): 2 years, loss -20%

Me (variable, 40% to 80% stock): 3 years, loss -37%

Considering that I was having a small net withdrawal, plus an initial high stock AA, I didn't do too badly.

If one looks at the stock market shape around the deep notch on 3/2009, one will see that it is a deep V shape, with broad shoulders. The S&P peaked out 16 months before that notch. Then, when it recovered, it was skimming the break-even line for several months before encroaching it.

So, if one was in an accumulating phase, fresh money invested would push his peak portfolio a lot closer to the notch, then pull it in a lot sooner during the recovery. And if one is in the withdrawal phase, his entire curve is slanted downward, and the two even points will stretch out to many more years. All that is evident in the results that posters reported.

When the next big drop comes, I will be fully in withdrawal phase and it will take a lot longer to see that money coming back, if at all. And it is going to be much more painful to throw money at the stocks that keep sinking into an apparent abyss.

It ain't easy.

I'm curious how you determined the recovery time for VWENX? When I pull up a price history chart it reached a high of $60.50 on 10/1/2007 and didn't hit that again until 1/1/2013 so it would seem it took more than 5 years to recover?
 
Let's look at the S&P from top in 10/2007 to bottom in 3/2009. Your $1 became 46 cents. What if the next time it will stay down there for a few years or a decade, as it had done before? And for young ER's living off their stash, and who are still a decade or two from SS? Buy, buy, buy? With what money?

Heh heh heh...


Not shabby at all. I am impressed. May I ask about your WR?

All the more reason no to go to a 100% equities allocation once ER'd. I remember a series of posts about a Y2K retiree 100% in SP500 and the sad tale that followed.

My WR varies year to year but generally in the 2.5 to 3% range. I spend the CG and dividends from taxable and if I need more, sell whatever needs to be sold to come back in the direction of my nominal 50/50.
 
It actually took more time to go down to the bottom. From 10/2007 to 03/2009, it took 13 months to get to the bottom (of my portfolio), but by 09/2009, it was back to the 10/2007 level (after just 5 months), with my regular contribution. So the total months are 18 with regular contributions.
 
ImageUploadedByEarly Retirement Forum1428947433.678727.jpg

Less than a year. Was dramatic (loss of $97,000) but short lived.
 
IIRC the market pundits were predicting something like 7-10+ years to recover, but for me it was about 2 years.
 
I'm curious how you determined the recovery time for VWENX? When I pull up a price history chart it reached a high of $60.50 on 10/1/2007 and didn't hit that again until 1/1/2013 so it would seem it took more than 5 years to recover?

The price charts do not include the effects of dividend and cap gain distributions. You need to go to Morningstar for that.

View attachment 21468

Less than a year. Was dramatic (loss of $97,000) but short lived.

$97K loss is not at all dramatic. In terms of dollars, my "loss" in the 2000-2003 stock rout was more than 6 times that. And when that coincided with the folding of the startups that I was involved with, that was dramatic. I took that down time to go to Europe for a vacation, before going back to figure what to do with the rest of my life.

Two years later, my portfolio regained and I felt confident enough to buy my 2nd home. Lucky? Yes. Fearless? Not quite.
 
I can't answer this question precisely because my practice was to do my portfolio and net worth calculations once yearly on March 31. My March 31, 2009 values were down significantly from the year before and I recall the sickening feeling as when I looked at my sinking portfolios online. I probably had paper losses of about half a million. But I didn't sell anything, and by March 31, 2010 both portfolios and NW had exceeded the March 2008 values. Of course I was w*rking at the time, pumping money into my investment accounts on a regular basis.

As the carnage unfolded I started investing in real estate (which is now self sustaining), bought some precious metals certificates (which I have recently sold at a profit), and began checking my portfolios daily, as the numbers were less shocking that way. I bought equities as the market passed its nadir, and also began stockpiling cash and building GIC ladders in preparation for ER. They help me sleep at night and if we have another crash, I can wait it out. I'm also spending considerably less in ER.
 
Last edited:
The price charts do not include the effects of dividend and cap gain distributions. You need to go to Morningstar for that.

Ah! Okay. So if I were living off those distributions and not reinvesting them, the VWENX price chart would be reflective of my situation and it would have taken a bit more than 5 years to recover?

(I'm looking at what those distributions were for that period of time and I'm confident they would have covered my buckle-down-it's-a-recession living expenses and I wouldn't have had to sell any shares.)
 
That's correct. If you can live off the dividends of your investments (currently 2.50% for Wellington, and 2.97% for Wellesley), then it is a lot safer. Quite a few posters here do that.
 
Let's look at the S&P from top in 10/2007 to bottom in 3/2009. Your $1 became 46 cents. What if the next time it will stay down there for a few years or a decade, as it had done before? And for young ER's living off their stash, and who are still a decade or two from SS? Buy, buy, buy? With what money?

Heh heh heh...

For short time periods I take the ostrich approach and simply don't look at the news, and avoid looking at my brokerage statements / update my net worth. But a multi-year decline/stagnation scares the heck out of me even though we have over 10 years expenses in bonds/cash.
 
Just look at Quicken, and it says 9 years in bonds and cash for me. But if I use some of that to "buy, buy, buy" when stocks are low, then it's not going to be 9 years.

I may just have to claim SS earlier than I want. And then, when Medicare comes in, I can use the health insurance money to buy cheap stocks.

If all that fails, well, as I often said, the NM wide blue sky awaits me and my motorhome.
 
My peak was in June of 2008. I had a huge amount of NW in a single stock that peaked about then. I sold a small amount (20%) and that mean my portfolio didn't decline by more than low 7 digits. It was back within a year or two.

Why do you ask this, I 'm retired, I don't slice it that thin.
 
Back
Top Bottom