You are using an out of date browser. It may not display this or other websites correctly.
You should upgrade or use an alternative browser.
You should upgrade or use an alternative browser.
Poll: How low will it go...
- Thread starter CaliforniaMan
- Start date
donheff
Give me a museum and I'll fill it. (Picasso) Give me a forum ...
So, how many people who jumped in late in 2017 hoping to catch the bandwagon are jumping out yesterday or today?
Unable to see any polls on mobile device but my vote is yawn if that is an option.
Yawn is always an option...
exnavynuke
Thinks s/he gets paid by the post
I voted 20% because that's what I'd like to see. Actually, I'd love a 50% drop and a recovery like we saw after the great recession.... but that's too unlikely imo.
Danmar
Thinks s/he gets paid by the post
I know some people think this is fun, but I’ve never understood the fun in trying to predict the unknowable? Might as well have a poll on what the weather will be on a given day next year? Anyway, I would guess it’s somewhere around 10-25% but I only know what I read in the newspaper.
kcowan
Give me a museum and I'll fill it. (Picasso) Give me a forum ...
I guessed 20% just for fun. As long as the new Fed chair stays away from any more foolish QE and lets nature take its course. If he continues the meddling, then anything is possible.
skipro33
Thinks s/he gets paid by the post
I think it will bounce at 20% and bounce back to around 10% before sitting flat as investors get themselves back under control. So I say 10%. Domestic corporations are going to start bringing money back into the USA with these new tax laws, investing in themselves and buying back their own stock, driving it back up. Hmmm... maybe this was a ploy to lower their costs in order to buy back their own stocks at discounted prices?
rollergrrl
Recycles dryer sheets
- Joined
- May 19, 2017
- Messages
- 69
I vote 44% drop [emoji855] and a slow recover for the next 10 years at about 4%
easysurfer
Give me a museum and I'll fill it. (Picasso) Give me a forum ...
- Joined
- Jun 11, 2008
- Messages
- 13,152
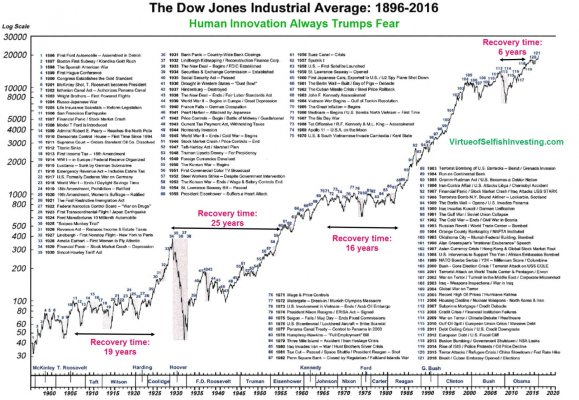
Here's an article with charts showing how long it took to recover from the major stock market downturns in the past.
Interesting with mentions of important events around those times.
https://www.marketwatch.com/story/the-dows-tumultuous-120-year-history-in-one-chart-2017-03-23Chris Kacher, managing director of MoKa Investors, published a graph of the Dow’s performance since 1896 that charts how the index’s peaks and troughs have reflected the U.S. economy’s triumphs and tribulations. But more than that, the graph also illustrates how the Dow has become a chronicle of investors’ responses to significant global events.
At its simplest, the chart proves once again that over the long term, the stock market always rises because “intelligence, creativity, and innovation always trump fear,” according to Kacher.
Yet at the same time, it also underscores the basic mantra that market participants need to stay nimble during times of uncertainty to maximize their returns.
Interesting with mentions of important events around those times.
Attachments
Remember , for every bad year you will have 3 good ones . We have lost everything from the beginning of the year . If I am correct we still have everything from 2017 . The indicators are just too good to just blow away. A lot of people will panic and will sell low and come back and buy high....again.
W2R
Moderator Emeritus
I know some people think this is fun, but I’ve never understood the fun in trying to predict the unknowable? Might as well have a poll on what the weather will be on a given day next year? Anyway, I would guess it’s somewhere around 10-25% but I only know what I read in the newspaper.
I agree. I didn't vote because I wouldn't know what percentage to vote for.
GravitySucks
Thinks s/he gets paid by the post
I vote 44% drop [emoji855] and a slow recover for the next 10 years at about 4%
Thanks.
Now I know I'm happy with my AA as the portfolio still survives a quick back of envelop check of 50% drop recovering in 10 years. The estate won't be so big though.
NW-Bound
Give me a museum and I'll fill it. (Picasso) Give me a forum ...
- Joined
- Jul 3, 2008
- Messages
- 35,712
Here's an article with charts showing how long it took to recover from the major stock market downturns in the past.
https://www.marketwatch.com/story/the-dows-tumultuous-120-year-history-in-one-chart-2017-03-23
Interesting with mentions of important events around those times.
Nice chart. It's reassuring to know the market recovery times in the past were 19 years, 25 years, and 16 years.

Many posters here do not have that long. Even I myself at 61 am not sure even. But it's OK. With a shorter lifespan, even if the stash gets halved and one's WR goes from 4% to 8%, he still does not outlive his stash. Problem solved.
Seriously, the chart is somewhat misleading as it shows only the stock price. In the past, particularly after the Great Recession, the dividend yield was very high by today's standard and reaching 10%.
One can live very well on that dividend without relying on the capital gain. It was only starting in the 1980s that P/E expansion reduced the dividend yield and boosted the price gain.
easysurfer
Give me a museum and I'll fill it. (Picasso) Give me a forum ...
- Joined
- Jun 11, 2008
- Messages
- 13,152
Nice chart. It's reassuring to know the market recovery times in the past were 19 years, 25 years, and 16 years.
Many posters here do not have that long. ..
Had the same thought.
On the bright side, the crash of 1987 and the dot.com bust was hardly a blip as for duration.
kcowan
Give me a museum and I'll fill it. (Picasso) Give me a forum ...
Well the newspaper is a poor source but I suppose the range you picked is wide enough to capture it!?.Anyway, I would guess it’s somewhere around 10-25% but I only know what I read in the newspaper.
I think the point of picking a future point is to learn whether you are poor at it or awful! If you were good, then you could make better use of your time than posting here.
Live And Learn
Thinks s/he gets paid by the post
Need an option for "Ask me again in 3 months time".
foxfirev5
Thinks s/he gets paid by the post
- Joined
- Mar 22, 2009
- Messages
- 2,987
No idea at all what might happen. But since I've only got $431 cash available to trade in my brokerage account it doesn't matter. It looks like the big chunk of cash I've dumped into CD ladders might keep me out of trouble. Also I still own the same number of equity shares so there should be some of those useless dividends coming in as well.
A bigger question is whether or not the dolphin will be biting tomorrow.
A bigger question is whether or not the dolphin will be biting tomorrow.
REWahoo
Give me a museum and I'll fill it. (Picasso) Give
More down coming. Buying in the 2400-2500 S&P.
Possible, but your track record as a market prognosticator indicates you have a credibility issue:
27k looks doable by the 31st
30k by May. Merrill Lynch says FOMO effect started. The greed stage should be good for another 10k dow points.
27k in February. 28k in March.
27k this week.
Danmar
Thinks s/he gets paid by the post
I think the point of picking a future point is to learn whether you are poor at it or awful! If you were good, then you could make better use of your time than posting here.
Doubt anyone is very good at it. Plenty of opinions though. Most of the talking heads talk about “higher volatity” before things “settle down”. That part is pretty obvious.
DrRoy
Give me a museum and I'll fill it. (Picasso) Give me a forum ...
More down coming. Buying in the 2400-2500 S&P.
And what will you do if we never get there?
NW-Bound
Give me a museum and I'll fill it. (Picasso) Give me a forum ...
- Joined
- Jul 3, 2008
- Messages
- 35,712
She does not miss the market. She's retired.The markets are missing Janet Yellen.

Similar threads
- Replies
- 45
- Views
- 4K
- Replies
- 35
- Views
- 2K