floatingdoc
Recycles dryer sheets
- Joined
- Oct 25, 2009
- Messages
- 58
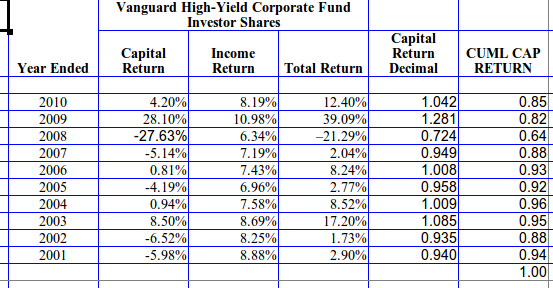
Can someone tell me why many people seem to think that the NAV of Vanguard's High yield corporate is destined to continue declining. Obviously, it is correlated closely with stocks and I understand that. The default rate for vheax was 0% for all of 2010 (source: vanguard). The dividend is paid based on the average coupon rate and proportion of bonds owned etc. It is currently yielding 7.6% with is treasury to hy spread of over 400 bp. Is the spread compared to the 5 year treasury or which one? Help please.