Yes. but if the gains are short term and the losses long term they won't offset. I'd rather have short term gains than none at all, but Ha raises a real issue (as he usually does) when bringing taxes into the discussion. No simple choice.If the poop hits the windmill and the puts come into the money in a significant way, you will have plenty of losses to offset your options gains.
You are using an out of date browser. It may not display this or other websites correctly.
You should upgrade or use an alternative browser.
You should upgrade or use an alternative browser.
Bullish?
- Thread starter JCW.82
- Start date
brewer12345
Give me a museum and I'll fill it. (Picasso) Give me a forum ...
- Joined
- Mar 6, 2003
- Messages
- 18,085
Yes. but if the gains are short term and the losses long term they won't offset. I'd rather have short term gains than none at all, but Ha raises a real issue (as he usually does) when bringing taxes into the discussion. No simple choice.
Uhhh, last I checked, ST gains will offset LT. Or am I misremembering?
Long term losses do not offset short term gains. The losses carry over and the gains are taxed at ordinary income rates.Uhhh, last I checked, ST gains will offset LT. Or am I misremembering?
A couple of things--
1. We have had two recessions in the last 10 years, one of which was probably the worst one since the thirties. So the earnings over the last ten years are probably a little depressed, compared to going forward.
2. Interest rates matter. I'm willing to pay a higher amount for the earnings of equities when my other options are so bad. Cash and bonds are yielding less than inflation.
Any thoughts on this chart? With a historical average market PE of about 16, the market looks a little overpriced. Of course, that didn't mean anything in the 90's or the 20's but there weren't many other periods in the last 100 years or so that were priced higher. I don't really have much experience with chart reading and I generally follow some basic rules of investing... choose a diversified mix of investments and rebalance your portfolio regularly to maintain the asset allocation. That said, not overpaying for an asset is also a good rule of thumb and it looks like the market is getting expensive. I've also seen charts and research that show we're only about halfway through a cyclical bear market that started in 2000 (couldn't find one to share unfortunately). Not sure how I feel about that as it's still all theory. My time horizon is very long so I'm not making major changes to my investment strategy, but I have made some slight adjustments. I'd love to get feedback from someone who follows this kind of data and has an opinion.
brewer12345
Give me a museum and I'll fill it. (Picasso) Give me a forum ...
- Joined
- Mar 6, 2003
- Messages
- 18,085
Long term losses do not offset short term gains. The losses carry over and the gains are taxed at ordinary income rates.
I don't believe this is exactly correct. An example of what my rather lazy search found:
Capital Losses
"Can I use a long-term capital loss to offset a short-term capital gain before using it to offset a long-term gain?
No, long-term capital gains and losses must first be combined to arrive at net long-term gain or loss before the result can be netted against the net short-term gain or loss. If you follow the Form 1040, Schedule D, Capital Gains and Losses, Parts 1 and 2, line-by-line, the form will perform the netting for you in this order."
In other words, you can offset ST gains with LT losses as long as you first net your LT gains and losses first and then still have more LT losses than LT gains.
Gone4Good
Give me a museum and I'll fill it. (Picasso) Give me a forum ...
- Joined
- Sep 9, 2005
- Messages
- 5,381
Any thoughts on this chart?
You don't say what the chart is, but to me it looks like PE-10.
By that measure, stocks have been overvalued since about 1990. It's tough to make investment decisions based on a metric that flashes sell for decades.
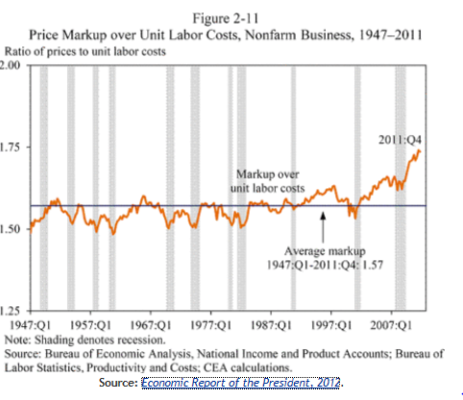
Of PE-10, one might ask why the measure seems less useful today than it was in the past. In other words, what changed? One possible answer is that corporations have become structurally more profitable as the value of labor has been depressed by global competition. A higher than historic share of profits would cause PE-10 to say stocks are over valued. The question becomes, will corporate profits mean revert or not? Short of a rapid acceleartion of international labor costs or a reemergence of private sector unions with real clout, I'm having difficulty understanding why this situation doesn't persist for quite some time.
Attachments
Last edited:
Gone4Good
Give me a museum and I'll fill it. (Picasso) Give me a forum ...
- Joined
- Sep 9, 2005
- Messages
- 5,381
In other words, you can offset ST gains with LT losses as long as you first net your LT gains and losses first and then still have more LT losses than LT gains.
That sounds right to me.
Mutual Fund ST Gains are treated as ordinary distributions and can't be offset with capital losses. But I don't think the same rule applies to normal ST gains not passed through a MF.
I stand corrected and beg your pardon for the earlier challenge. Long have I labored under this misconception. It's a good day when you learn something like this..
brewer12345
Give me a museum and I'll fill it. (Picasso) Give me a forum ...
- Joined
- Mar 6, 2003
- Messages
- 18,085
I stand corrected and beg your pardon for the earlier challenge. Long have I labored under this misconception. It's a good day when you learn something like this..
You had me scared for a minute there that I had been doing it wrong.
NW-Bound
Give me a museum and I'll fill it. (Picasso) Give me a forum ...
- Joined
- Jul 3, 2008
- Messages
- 35,712
Yes, this chart is indeed PE-10, which is the average PE over the past 10 years.Any thoughts on this chart? With a historical average market PE of about 16, the market looks a little overpriced...
The current P/E ratio of the SP500 is around 16, and not 22.8 as the PE-10 shows.
If one wants cheaper stocks, there is emerging-market stock, with PE of 12 for an index (FTSE perhaps, I forgot). Also, a PIMCO money manager recently pointed out that emerging-market bonds also have better yields than US ones, yet emerging countries are not laden with debt like developed countries are.
Moreover, I find it interesting that Burton Malkiel, the author of the well-known book "A Random Walk Down Wall Street" and a buddy of John Bogle, also noted in more than one recent article or interview that emerging stocks and bonds should be good buys. As a proponent of the Efficient Market Hypothesis, albeit only in the weak sense, meaning that in the short-term the market may act irrationally (of course we know this), his stance is noteworthy.
Last edited:
Yes, this chart is indeed PE-10, which is the average PE over the past 10 years.
The current P/E ratio of the SP500 is around 16, and not 22.8 as the PE-10 shows.
If one wants cheaper stocks, there is emerging-market stock, with PE of 12 for an index (FTSE perhaps, I forgot). Also, a PIMCO money manager recently pointed out that emerging-market bonds also have better yields than US ones, yet emerging countries are not laden with debt like developed countries are.
Moreover, I find it interesting that Burton Malkiel, the author of the well-known book "A Random Walk Down Wall Street" and a buddy of John Bogle, also noted in more than one recent article or interview that emerging stocks and bonds should be good buys. As a proponent of the Efficient Market Hypothesis, albeit only in the weak sense, meaning that in the short-term the market may act irrationally (of course we know this), his stance is noteworthy.
Thanks. Do you have a link to some data showing the current PE is 16? I haven't seen that but would feel much better if that were true. This chart was the only one I could come up with.
NW-Bound
Give me a museum and I'll fill it. (Picasso) Give me a forum ...
- Joined
- Jul 3, 2008
- Messages
- 35,712
It is 15.86 on this day of 3/9/2012, according to the WSJ site here.
From the same site, the estimated forward P/E is 13.10, meaning the earnings are expected to improve down the road.
I have problems finding a historical chart, and could only locate the following one.

From the same site, the estimated forward P/E is 13.10, meaning the earnings are expected to improve down the road.
I have problems finding a historical chart, and could only locate the following one.
audreyh1
Give me a museum and I'll fill it. (Picasso) Give me a forum ...
I thought current P/E was around 14, and the trailing chart you published shows about 14. I thought it was 15 about a year ago.
Last edited:
NW-Bound
Give me a museum and I'll fill it. (Picasso) Give me a forum ...
- Joined
- Jul 3, 2008
- Messages
- 35,712
Your number may not be up-to-date. The S&P is up 9% year-to-date, so the P/E is up also.
Eh, I am not complaining. How about you?
Eh, I am not complaining. How about you?
It is 15.86 on this day of 3/9/2012, according to the WSJ site here.
From the same site, the estimated forward P/E is 13.10, meaning the earnings are expected to improve down the road.
I have problems finding a historical chart, and could only locate the following one.
Thanks much NW. This is good news and I can see why many of you are more bullish now. It helps to have the correct chart!

marko
Give me a museum and I'll fill it. (Picasso) Give me a forum ...
- Joined
- Mar 16, 2011
- Messages
- 8,427
There is still about 3 TRILLION sitting on the sidelines.
Corporations are sitting on tons of cash, waiting for clarity on regulations and healthcare.
Experts still optimistic of a 1400 S&P by year end.
A big spike in June/Sept time frame? Nov 3 rally?
Corporations are sitting on tons of cash, waiting for clarity on regulations and healthcare.
Experts still optimistic of a 1400 S&P by year end.
A big spike in June/Sept time frame? Nov 3 rally?
Gone4Good
Give me a museum and I'll fill it. (Picasso) Give me a forum ...
- Joined
- Sep 9, 2005
- Messages
- 5,381
I thought current P/E was around 14, and the trailing chart you published shows about 14. I thought it was 15 about a year ago.
According to S&P, LTM actual operating earnings were $94.64. At a closing price today of 1,370 that puts the trailing PE at 14.47x (Dividend yield of only 1.9%, though)
Last edited:
NW-Bound
Give me a museum and I'll fill it. (Picasso) Give me a forum ...
- Joined
- Jul 3, 2008
- Messages
- 35,712
Damn it! We all know about P, but people seem to not be able to agree on the E part.
I thought they fired or jailed all the culprits who concocted phony E's after the 2000 tech bubble.
Just can't trust these accountants!
I thought they fired or jailed all the culprits who concocted phony E's after the 2000 tech bubble.
Just can't trust these accountants!
audreyh1
Give me a museum and I'll fill it. (Picasso) Give me a forum ...
Yeah - that must be the difference. Oh - I see Gone4Good brought in more data!Your number may not be up-to-date. The S&P is up 9% year-to-date, so the P/E is up also.
Eh, I am not complaining. How about you?
Although I'm still reading things like "The S&P 500 traded at 14.1 times earnings when the market hit its most recent high on March 1. That’s the lowest valuation of any 52-week market high going back to 1989." The Bull Market Turns Three. Where's the Party? - Businessweek
I assume they are talking about trailing earnings.
Well, anyway, 14 SOMETHING! That's not bad, really.
Audrey
Last edited:
obgyn65
Thinks s/he gets paid by the post
No. I am 100% fixed income. Don't want shares, and doubt I ever will.
Bullish?
Hmmm, I am beginning to think that a lot of people have become reflexively pessimistic over the last several years. I see lots of things moving in the right direction: profits, labor market, funding conditions, etc. With the Greece exchange in the rearview mirror, perhaps some of these positive developments will occupy more of the media's attention.
Well, now you've done it. That's as close to "Wheeee!!" as I've ever heard from you.I see credit market conditions improving meaningfully as well. The investment grade market is wide open and investors are thrusting cash at such issuers. Junk spreads have been dropping to the point where it is attractive for many junk issuers to refinance or pound out new bonds. The bank loan market also seems to be easing somewhat based on a few refinancings/amendments that allow for much more borrower flexibility and often a lower cost of funds.
I'll be liquidating all my equities on Monday and moving to gold bullion. And shotgun shells. And MREs. And shorting the TSM... on margin.
brewer12345
Give me a museum and I'll fill it. (Picasso) Give me a forum ...
- Joined
- Mar 6, 2003
- Messages
- 18,085
Well, now you've done it. That's as close to "Wheeee!!" as I've ever heard from you.
I'll be liquidating all my equities on Monday and moving to gold bullion. And shotgun shells. And MREs. And shorting the TSM... on margin.
Nah, I am a patient deep value bottom fisher, not a permabear. There are still plenty of hurdles, I just think that the public at large is excessively pessimistic and does not see the slow, steady improvement.
Although I did fill the 55 gallon barrel of emergency water today (mostly cause we live in a dry climate and would be hosed if the water was off for a day) and shotgun shells (my newly acquired toy is 20 gauge and I don't have any of that).
Betcha never used sentences like that in NJ. At least I hope you never had to.Although I did fill the 55 gallon barrel of emergency water today (mostly cause we live in a dry climate and would be hosed if the water was off for a day) and shotgun shells (my newly acquired toy is 20 gauge and I don't have any of that).
Looks like you've made the transition to your new culture just fine. At least you'll never have to wear the cowboy hat on Wall Street...
brewer12345
Give me a museum and I'll fill it. (Picasso) Give me a forum ...
- Joined
- Mar 6, 2003
- Messages
- 18,085
At least you'll never have to wear the cowboy hat on Wall Street...
Ah, but I did on a regular basis prior to making my escape. I did draw the line at the big, silver belt buckle with the turquoise embedded in it.
My coworker could not understand the concept of it not being legal to hunt deer with a rifle in all of NJ and much of NY. I think it clicked when I pointed out that NJ alone has CO's population in an area 1/12 the size.
The last thing I want to do is let a bunch of licensed Wall Street guys shoot for the big bucks...My coworker could not understand the concept of it not being legal to hunt deer with a rifle in all of NJ and much of NY. I think it clicked when I pointed out that NJ alone has CO's population in an area 1/12 the size.
Similar threads
- Replies
- 26
- Views
- 885
- Replies
- 24
- Views
- 2K