target2019
Give me a museum and I'll fill it. (Picasso) Give me a forum ...
#124 is linked to/from Twitter.
#124 is linked to/from Twitter.
I see nothing and I don't have a Twitter account so maybe that has something to do with not seeing any link?
My first guess is that your ad blocker is doing this...

I think my Chromebook is haunted. Some charts show, some don't. I give up.


Another way to look at it. In 1980 interest payments on the national debt were 1.84% of GDP. In 2018, they were 1.58% of GDP. In 1991, they were 3.15% of GDP. I think we're fine.I don't know how a chart could be made from this, but....
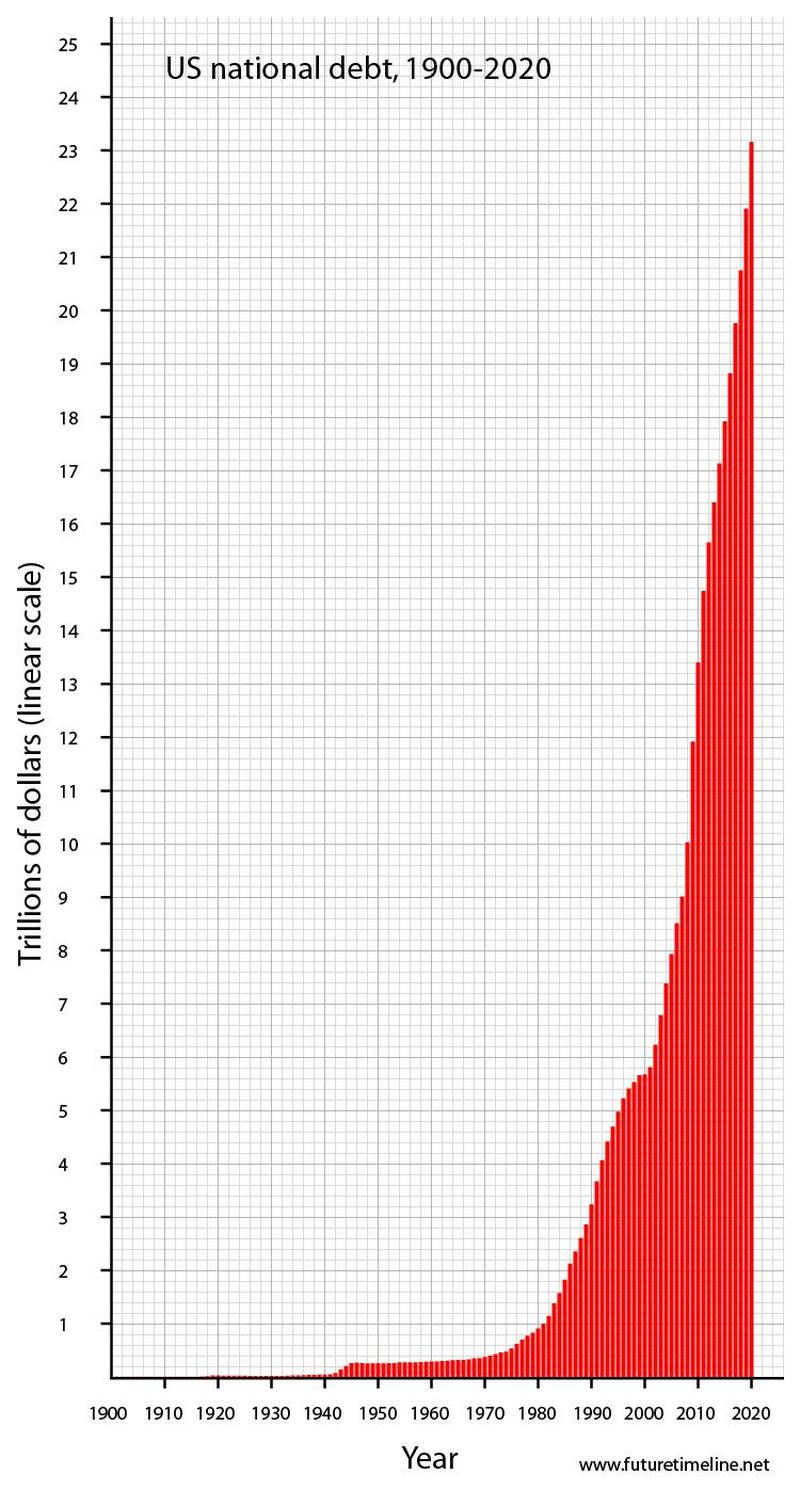
In 1980, the TOTAL National Debt... not month or year... but the total National debt was under one Trillion dollars. It took 234 years to reach that level.
Last month, the national debt increased by 134 Biilion dollars in one month which would work out to about 1.6 Trillion dollars in a single year.
BTW.. we just reached 23 trillion two days ago.
Someone said "numbers is hard"