Running_Man
Thinks s/he gets paid by the post
- Joined
- Sep 25, 2006
- Messages
- 2,844

This is why (IMHO) you want to avoid bond indices tied to the Agg.
Well, it's a new year and I looked over my MC 401k holdings and performance. I hold a combination of SP500 fund (largest holding) and several 401k "age-based Life Time hybrid funds" which include some "Principal Bond Market Index SP" fund. The bond index fund percentage of holdings range from 9% for 2050 retirement date fund to 30% for 2025 retirement date.
My bond idx total exposure is around 8% of 401k balance. It is a new year and now would be a good time to address any potential exposure.
I want to retire ASAP.
Should I change my 401k AA to minimize the bond index risk?
I thought about rolling the 401k over to my traditional IRA (which has more options for bond/preferred stock exposure) but have read that the 401k has creditor/lawsuit protection compared to Traditional IRA holdings. Any thoughts on this?
This is why (IMHO) you want to avoid bond indices tied to the Agg.
These charts would be a lot more interesting if you would add some comments to explain we're supposed to take away from the chart. Maybe I'm the only one though, and everyone else gets it.
This link has explanation with a chart.These charts would be a lot more interesting if you would add some comments to explain we're supposed to take away from the chart. Maybe I'm the only one though, and everyone else gets it.
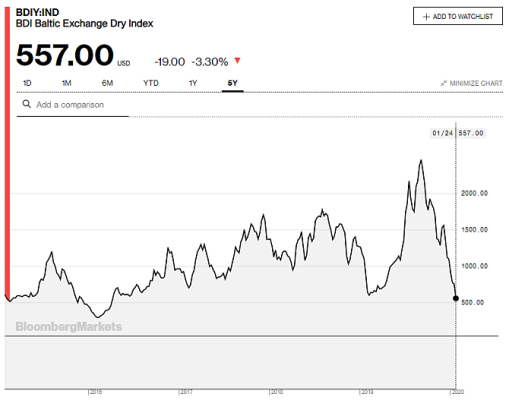
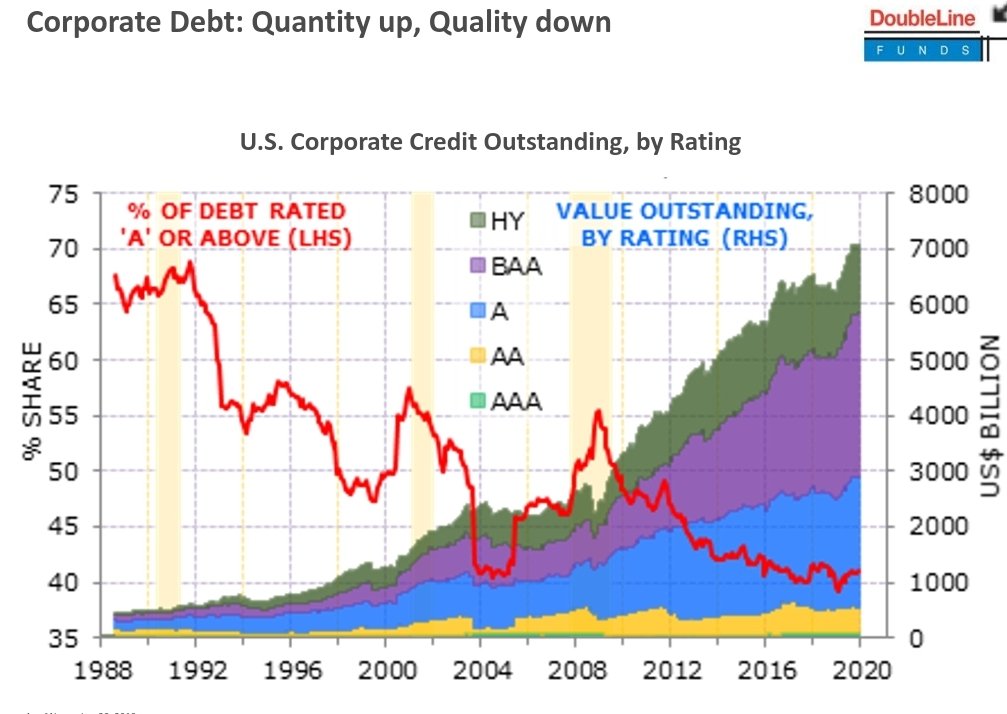
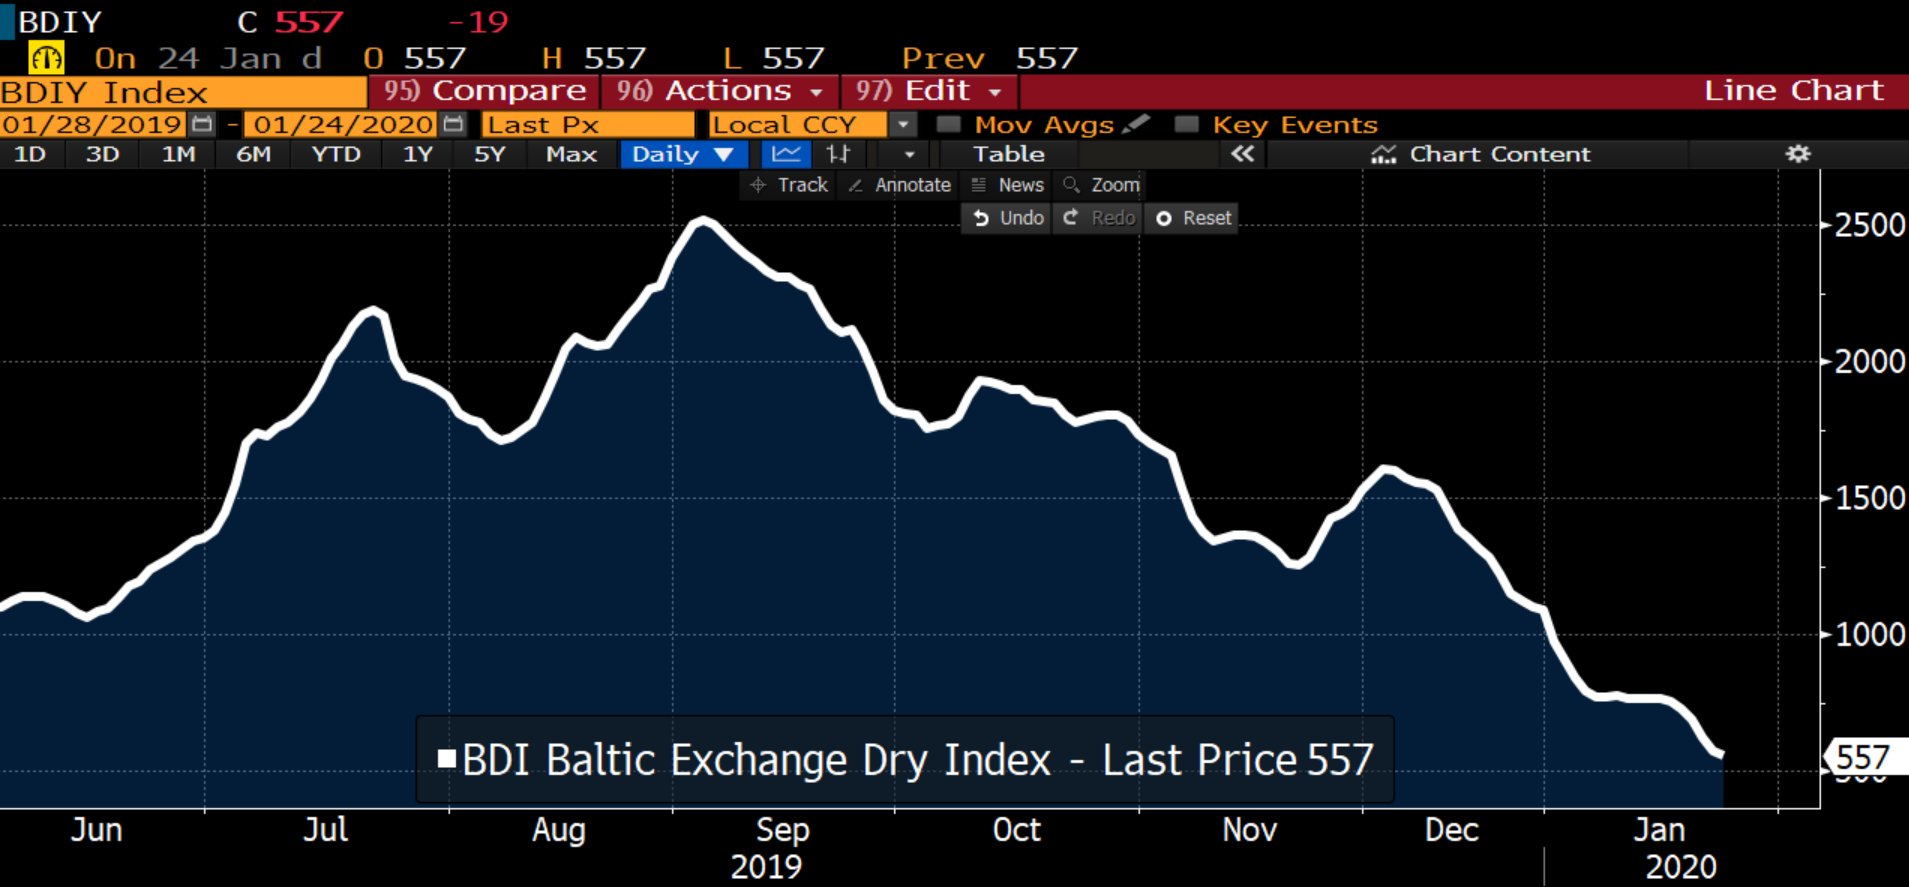
The bonds chart is showing that total quantity of lower quality bonds is increasing - while the actual financial quality of the range is in decline. The BDI is a shipping index which shows it is 78% cheaper to contract to ship something now than it was last summer, which either indicates a lack of demand for international shipping or an oversupply of freight availability. I view it as an indicator of future economic activity, but only as one piece of a bigger picture.These charts would be a lot more interesting if you would add some comments to explain we're supposed to take away from the chart. Maybe I'm the only one though, and everyone else gets it.
These charts would be a lot more interesting if you would add some comments to explain we're supposed to take away from the chart. Maybe I'm the only one though, and everyone else gets it.


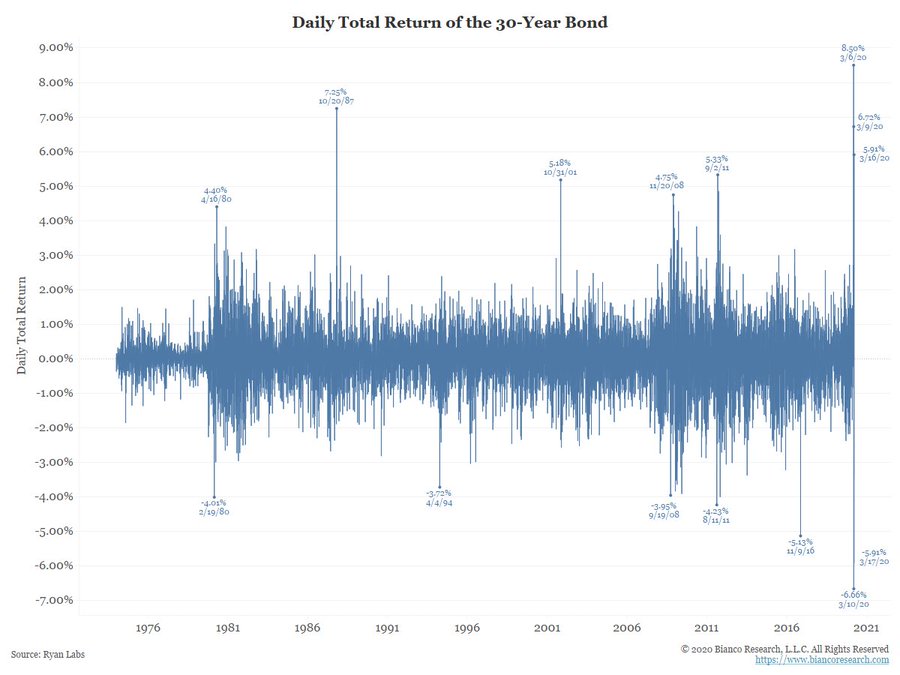
Daily moves in US bond market


yeah... but this time is different.