Hyperinflation? Deflation? What to do??

novaman

Recycles dryer sheets
Joined
May 12, 2007
Messages
444
I hear arguments for possible hyperinflation, and arguments for possible deflation. Real estate is not good, their is talk that the market is headed for another drop, MM and CD rates stink.....

Seriously, what's a guy to do at this point with his money?
 
Pick an asset allocation you can live with for the long run and focus your eyes on the horizon, not on your feet.

When your AA goes to pot (temporarily, of course), it might be okay to focus on your navel. Or for us contrarians, as they say at the coffee shop, "As you voyage along thru life, let this be your goal, always look upon the donut and not upon the hole."
 
Pick an asset allocation you can live with for the long run and focus your eyes on the horizon, not on your feet.
Agreed. I'd add a possible wrinkle: If someone wants to take a fraction of their portfolio for "protection" against events like high inflation, deflation, depression and the dollar going into the tank, something like the Permanent Portfolio might be worth a look. I'm doing the PP with about 20% of my portfolio overall and the rest of it in a fairly conventional 60/40 AA.
 
If you are uncertain or worried about the inflation v deflation question, my simplistic and amateurish views are:

1. asset allocation strategies - as long as different asset classes keep fluctuating and are not highly positively correlated, over the longer term there will be opportunities to benefit through rebalancing. The permanent portfolio mentioned by ziggy29 has its advocates and may well be a relatively safe option for people who want to protect themselves from either possibility

2. assets that produce cash flow give better flexibility than those that do not because you are less dependant on timing sell decisions to generate cash to pay for the bills (this says nothing about total returns which is another issue)

cheers
traineeinvestor
 
There sure has been a lot of talk about pot lately....
I bought a huge pot of basil today; a very strange lady on the bus gave me advice on how not to kill it: give it ice cubes about every two weeks, or wait until it almost plops over (goes to pot?) then put ice cubes all over the top of the soil. I don't know what she was smoking.
 
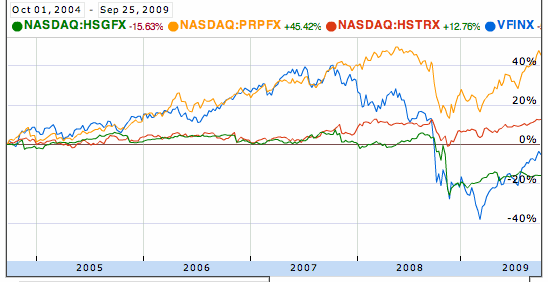
hstrx
prpfx
hsgfx
Here's a chart of these three, along with the well known VFINX.
funds.gif
Pretty dramatic differences. Thanks for pointing them out.
 
That's pretty cool but I'm not sure I understand your chart..AS of 8/31/09 HSTRX has an annual average return of 7.54%..And HSGFX had an average annual return of 3.01%...Is that what your chart shows?
 
OK, lemme go check just what these charts show, but I assume that they are just daily NAV.
I admit to knowing absolutely nothing about this funds. I'm having a look.
 
Welll, you could try this:

"He has created a version of Harry Browne's famous "permanent portfolio," described in a 1981 book authored with Terry Coxon titled Inflation-Proofing Your Investments. They hedged against the big four: inflation, deflation, recession and prosperity. In four equal portions, they suggested an S&P500 stock index fund for prosperity; 25% long-term bonds for deflation; 25% cash for a recession; and 25% gold bullion for hyperinflation or currency devaluation."

Worry-free plan: Gold, bonds and cash
 
That's pretty cool but I'm not sure I understand your chart..AS of 8/31/09 HSTRX has an annual average return of 7.54%..And HSGFX had an average annual return of 3.01%...Is that what your chart shows?
The charts I showed are comparative ones. Note that they all start at zero and show percentage gain or loss after that. They make HSTRX look pretty good. It looks good even when compared to a popular balanced fund like Vanguard Wellington.
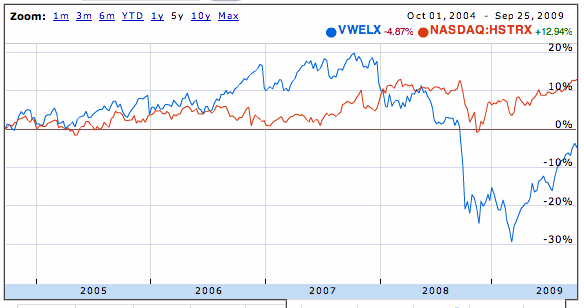
funds2.gif
These are Google charts and I believe that they do not include dividends, but can't be sure. Maybe somebody can weigh in on this. I think Audrey has said that M* charts can be persuaded to include dividends.
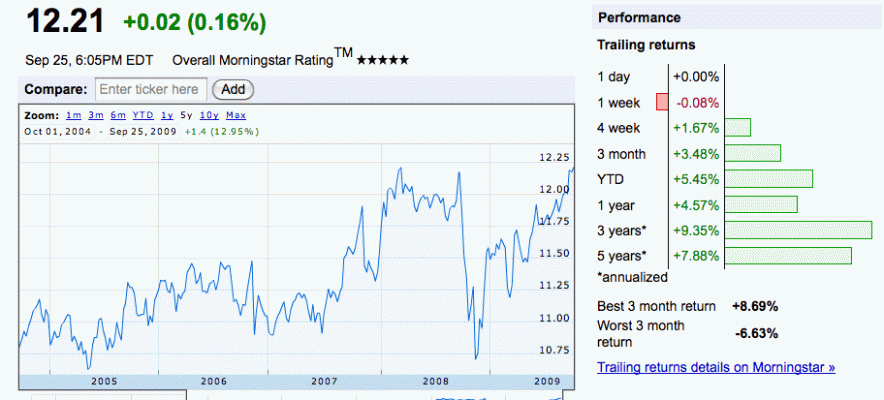
As for the average returns, I don't know what the time frame is for the returns you quoted, but in any rate, the charts above are not about average return. Here is a full Google chart of HSTRX with average returns shown to the right.
funds3.gif
Hussman Strategic Total Return (HSTRX) - Google Finance
This chart is different from the others because it is not comparative and shows actual NAV. The 5 year yield of 7.88% shown here is not that different from the 7.54% you mentioned.
Yahoo financial quotes a yield of 0.4% and a YTD return of 3.81% for HSTRX.
HSTRX: Summary for HUSSMAN STRATEGIC TOTAL RETURN - Yahoo! Finance
This does not agree with Google's YTD of 5.45%, but maybe the ending dates are different. Sorry that this is turning into a statistial mess.

Gotta go now, more later if desired. My SO just walked in with a brand new MacBook Pro for me. And that, my friends, takes precedence.
 
Back
Top Bottom