Is this rally for real?

May I modify your metaphor by suggesting that we are not spectators on shore, but swimmers in the ocean?

And we just got hit by a tsumani wave, for crying out loud. We all thought we were good surfers, but as it turned out, we were thankful to stay alive and not drowning (knock on wood).
Excellent! :D
I just hope we never become driftwood. :nonono:
 
Not mine, I'm still scared shatless. But it is amazing and I'm glad for it. Maybe the market will continue to go up for awhile as a result. And we can all recoup a little more.:)
I'm still keeping my eyeballs on it, but after recouping some dough, I feel much better. Let it roll...........
 
It is astonishing how much attitudes have changed in 5 short months.

Ha

Not me. I've been selling into the recent rallies and will continue next week if the market is up. I'm maintaining my new allocation per Bogle of 38/62 where your bond allocation equals your age.:)
 
Quiet? My earlier post was dated 8/6/09. We only skipped one day.
But that one day - 8/7/09 - was truly an extraordinary day in the markets. So I was amazed by the quietude here. I guess everyone was just frozen in awe.

Audrey
 
Some may be froze in awe, and afraid to jinx. Others frozen in fear, afraid they have missed the boat. But it is likely that most are frozen one way or another. Animal spirits reign supreme once again!

Me - I'm happy this is happening and trying to stay focused on the important things in life - enjoying my family and good health.

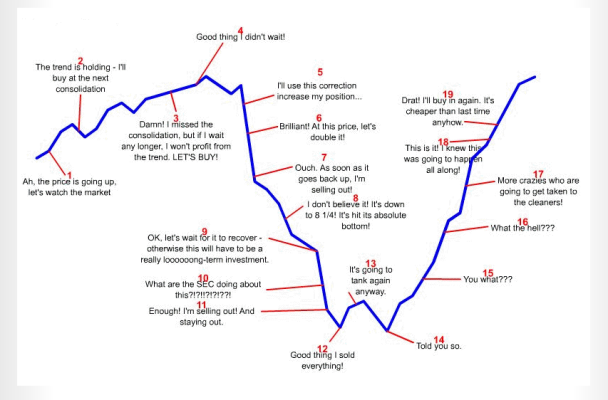
Wonder where we are here - a graph from this thread http://www.early-retirement.org/forums/f28/funny-investor-sentiment-graph-37912.html
 

Attachments

  • investorgraph.png
    investorgraph.png
    166 KB · Views: 29
I king of think we are at 16 - What the h#ll? Although, it might be 17. Maybe the question "Is this rally for real?" was really question 16, in which case we might be approaching 17.

Personally I think the graph should go back to repeat 5 and stop there just so that someone doesn't get the impression that all is clear after a big V recovery and really leave folks hanging with an uncertain future (i.e. is it a "dip" or are we about to "fall off a cliff"? - the age old question).

Audrey
 
Here's a graph showing bear market stages according to Bob Farrel's rule #8 that bear markets have 3 stages 1) sharp down 2) reflexive rebound and 3) drawn-out fundamental downtrend. (Farrell was a market strategist at Merrill Lynch from the 60's to the early 90's)

bear+market+stages.png (image)

I got the graph from this site which I don't always agree with but read as an antidote to the mainstream news"green shoots" hyper-optimism.
Mish's Global Economic Trend Analysis
 
Here's a graph showing bear market stages according to Bob Farrel's rule #8 that bear markets have 3 stages 1) sharp down 2) reflexive rebound and 3) drawn-out fundamental downtrend. (Farrell was a market strategist at Merrill Lynch from the 60's to the early 90's)
It's interesting, but part of the question is whether or not the chart should be looked at as one horrific market from 2007 to early 2009, or if the chart should be looked at as a longer term "double bottom" bear market from 2000 to 2009.

As a corollary, if we want to compare the current market to that of the 1930s (say the chart from 1929 to about 1940), where are we? Is this like 1933, a big snapback after a bottom, only to hit another bear-within-a-bear in 1937? Or was the March 2009 low akin to the 1937 low, where we have a secular bear market double bottom in 2002 and early 2009 as we had in 1932 and 1937 -- making the recent action more like 1938 than 1933? A lot of chartists and Elliott wave types seem to think the March bottom was a lot like the 1937 low and that recent bullish activity is similar to the 1938 stock market recovery.

Personally, I think we're way too deep in this secular bear market cycle (for more than 9 years if indeed we're still in it) for this to be more like 1930 or 1931.

Obviously every market is different, but given how many people have been trotting out the 1930s about this market and this economy, it's interesting to note and ponder. I wouldn't make any investment decisions based on it, obviously.
 
Yes, I agree. This "bear market" started in 2000. It might not end until 2017 - AAAaaaaargh!

Well, whatever - expect continued multi-year rollercoasters for a while.

Audrey
 
Yes, I agree. This "bear market" started in 2000. It might not end until 2017 - AAAaaaaargh!

Music to my ears!!! Bear market until 2017 = 8 more years to invest at low low prices. I think that would do the trick for my portfolio. :D
 
The title of this thread is misleading. Of course this rally is real, it has caused the SPX to increase over 50% in less than 6 months.

Better questions are how long will it last? How far will it go? What might come after it stops? Nothing can go up at this rate forever, so this rally will prove limited as to time and size. It doesn't necessarily mean SPX will go back down, though it may.

I tend to believe that once people have been well frightened, their fear can return faster if things start looking dicey than it came in the first instance.

Against that POV is that it does seem that the glue applied during the last many months is having an effect.

My conclusion is that this is not a market for broad brush investing, but more for market timing and/or special situations.

I think with the very heavy fixed income allocations that many here use, it really doesn't matter. In effect they are saying "I don't have enough at risk to sweat it, so I won't."

This seems like a good plan, but it is somewhat undercut by a simultaneous reliance on FireCalc. FireCalc is not fond of high fixed allocations and long withdrawal periods- to say nothing of 2-4% interest rates. :)

Edited to add an interesting Yahoo interview for your discerning pleasure:

http://finance.yahoo.com/tech-ticke...ays?tickers=intc,mot,ebay,qqqq,skf,^DJI,^GSPC

Ha
 
The 8/14 ECRI weekly update

Meanwhile, the index's annualized growth rate leapt to a 26-year high of 13.4 percent from last week's five-year high of 10.4 percent, which ECRI originally reported at 10.5 percent.

It was the index's highest yearly growth rate reading since the week to Aug. 26, 1983, when it stood at 13.9 percent.

"With WLI growth surging, the odds are rising that the early stage of this economic recovery will be stronger than any since the early 1980s," said Lakshman Achuthan, Managing Director at ECRI.
ECRI | News | Media Coverage
 
So what do you think of the validity of ECRI's statement? It seems to me the idea of stagflation is much more likely. I continue to be afraid of the large debt of the average American along with the national debt. We have been a credit card economy for a long time and I fear with increasing debt this will no longer fuel a recovery.

But what do I know? I should have invested when the Dow was at 7000.

ECRI does not make economic forecasts or long term projections, they measure and forecast business cycles turns, relative strength and timing. I have read and followed them for years and had a paid subscription until they closed their retail business.

In the current economic cycle they forecast the recession late '07 or early '08 - easily ahead of the pack - and were both early and correct in forecasting the current upturn.

I have never regretted following their advice but do have misgivings for not doing so.
 
So what do you think of the validity of ECRI's statement? It seems to me the idea of stagflation is much more likely. I continue to be afraid of the large debt of the average American along with the national debt. We have been a credit card economy for a long time and I fear with increasing debt this will no longer fuel a recovery.

But what do I know? I should have invested when the Dow was at 7000.
What do I think of their validity? Higher than any other predictive model I've seen published - by quite a long shot. Note that they are predicting the economy, not the markets. Their model predictions might not make sense to someone looking at current economic challenges, but obviously their models are seeing other factors that are overcoming these challenges.

On Stagflation - ECRI does point out that the future inflation gauge reached a 51 year low in March. That's pretty significant - the lowest inflation pressures in 51 years!!! It has risen persistently since which ECRI indicates means deflation risks have eased, but is still well below where it was a year ago. Here's what they said most recently about inflation ECRI | News | Media Coverage

Note that the ECRI models really only are able to forecast out 6 months max. So they can't tell you long term trends.

But, I would say ECRI is telling us that the stagflation scenario is not likely in the near term due to both improved economic growth going forward AND inflation still not so bad.

Audrey
 
Rally does not make sense if what you are fighting for is not the issue to be solved. Be a good citizen by following rules and regulation.
 
If the ECRI is correct on their predictions on the economy then it would appear this would be a good time to move into stocks.

How many of you have decided this information means a higher stock market and have or are moving funds into stocks?
 
How many of you have decided this information means a higher stock market and have or are moving funds into stocks?

Being retired, the question I have is do I "cash out" some of my annual gains (while much less in value than Jan 1, 2007, much higher than their purchase price over the last 25+ years).

I normally do my portfolio adjustments in December, after the annual distributions are made. I don't buy into equities (as I did during my work*ing years, but just sell off perceived profits to add to my retirement cash bucket).

While my target for my retirement gross income cash bucket is 3-5 years, it has dropped to a bit over 2 years due to not selling anything the last two years (e.g. I still have all my shares, plus re-invested distributions).

The question is should I sell now, wait till December (to take this year's profits) or possibly wait another year till the market may return and at least show a slight positive return over Jan 1, 2007?

If I look over my 3-5 year fund returns, in many funds I do have a positive return; however my returns since Jan 1, 2008 are negative.

While I have enough income for a couple of more years without selling anything, should I sell since the market is on a bit of a run?

Sometimes, having money is more difficult than not having money, since the game is to retain your assets, rather than build them :angel:.

Just another POV...
 
If the ECRI is correct on their predictions on the economy then it would appear this would be a good time to move into stocks.

How many of you have decided this information means a higher stock market and have or are moving funds into stocks?
Another very strong indicator for a higher stock market in the near term - (almost?) all the general equity indices have made very strong 50/200 daily moving average crossovers in recent history with the 200 daily MA finally starting to trend upwards. In the past, this has been a very strong buy signal for market timers.

Me? Well, my model had me rebalancing recently which means that I trimmed some of my stock funds to buy bond funds. Kind of anti-timer I guess!!! However, if the market move up is as strong as all these wild indicators seem to suggest, I may have another opportunity to rebalance before too long.

We shall wait and see........

Audrey
 
If the ECRI is correct on their predictions on the economy then it would appear this would be a good time to move into stocks.

How many of you have decided this information means a higher stock market and have or are moving funds into stocks?

I have always heard that the market moves ahead of the news. So perhaps the huge move up we have seen since March was pushed by the anticipation of a strong early recovery. It might be too late already to move into stocks as the good news might already be priced in. I have rebalanced out of stocks last week to lock in some of the gains of the past 4 months personally. I don't see the market go much higher anytime soon since it will probably take several years before unemployment start to recede, foreclosures stop undercutting the RE market and banks/companies/people finish deleveraging. In hindsight, the best time to move into stocks was probably late 2008 / early 2009 when the markets were pricing in a second great depression.

But who knows?
 
If I were to get back into stocks, then you can bet that would be a very bearish signal. I want to wait until the Fall and see what happens. I would rather be safe than sorry and I can still see the possibility of a large sell off. But as you say who knows, maybe Jim Crammer (I am joking). Although I do like Erin Burnette
 
Yes, I think this rally is for real. So does the author of this article:

Professionals Are Buying The Stock Market Rally. Are You: Tech Ticker, Yahoo! Finance=

Professional money managers are buying into the rally in a big way, according to a Merrill Lynch Survey of Fund Managers :
  • 75% believe the world economy will improve in the next 12 months. That's the highest level in nearly six years and up from 63% in July.
  • Average cash balances have fallen to 3.5%, the lowest since July 2007.
  • 34% of managers surveyed are now overweight stocks, the highest since Oct. 2007.
  • Risk appetite is also increasing, to the highest levels in two years.
 
Back
Top Bottom