Top 10 portfolio performance?

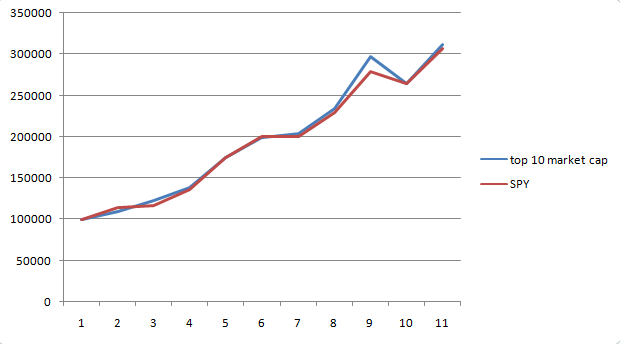
Regarding the top 4, for 2010, dec 2009 info was used, for 2011 dec 2010, etc.
...

For those top 4, it worked out well for 2010-2018 since they didn’t change, if there is change in the top 4, I’m sure performance will go down quick. ...

top 1 to 10
Dec-09 XOM MSFT WMT GOOG AAPL JNJ PG IBM T JPM
Dec-10 XOM AAPL MSFT BRK-A GE WMT GOOG CVX IBM PG
Dec-11 XOM AAPL MSFT IBM CVX GOOG WMT BRK-A GE PG
Dec-12 AAPL XOM GOOG WMT MSFT BRK-A GE IBM CVX JNJ
Dec-13 AAPL XOM GOOG MSFT BRK-A GE JNJ WMT CVX WFC
Nov-14 AAPL MSFT XOM GOOG BRK-A JNJ WMT WFC GE PG
Dec-15 AAPL GOOG MSFT BRK-A XOM AMZN FB GE JNJ WFC
Dec-16 AAPL GOOG MSFT BRK-A XOM AMZN FB JNJ JPM GE
Dec-17 AAPL GOOG MSFT AMZN FB BRK.B JNJ JPM XOM BAC
Dec-18 MSFT AAPL AMZN GOOG BRK.A FB JNJ JPM V XOM

I'm not following you. What do you mean the top 4 did not change? Your table says they did change. And even if you meant "did not drop out of the top 4" or "the top 10", that doesn't seem true either.

I'm confused. What allocation of those 4 ( XOM MSFT WMT GOOG I assume?) did you use for you chart?

-ERD50
 
...but I was trained as a scientist and and engineer. Anecdotes and arm-waving don't do it for me...


This does it for me. Glad I wasn't trained as a scientist and an engineer (apparently, it's a terrible combination):). Throw in a couple of anecdotes about her and just perhaps a whole new world will open up to you. You can thank me later.
 
Last edited:
I'm as greedy as the next person, but I was trained as a scientist and and engineer. Anecdotes and arm-waving don't do it for me. Give me data (not backtesting) that shows another investing method has consistently beaten passive and I'm in with $100K for the experiment.

While your'e at it, please also explain specifically what you are talking about when you say "fake index backtesting to 1926."

For instance they will quote the S&P500 has returned 9% since 1926. In 1926 S&P had 90 stocks in the index, it was not until 1957 that the S&P added to 500 stocks, there is an assumption of what stocks would have been added in 1926 while knowing the results of 1929 - 1938 and there was no way to invest in the index at the time.
 
For instance they will quote the S&P500 has returned 9% since 1926. In 1926 S&P had 90 stocks in the index, it was not until 1957 that the S&P added to 500 stocks, there is an assumption of what stocks would have been added in 1926 while knowing the results of 1929 - 1938 and there was no way to invest in the index at the time.

Does it matter? We can't get in a time machine and buy those stocks anyway. It seems any reasonable proxy for "the market" is what we are interested in from a historical research view.

Maybe later I'll dig a bit deeper to see how Schiller handled this, but I'm assuming he gave it some serious thought and had no motivation to bias it:

Online Data - Robert Shiller

-ERD50
 
For instance they will quote the S&P500 has returned 9% since 1926. In 1926 S&P had 90 stocks in the index, it was not until 1957 that the S&P added to 500 stocks, there is an assumption of what stocks would have been added in 1926 while knowing the results of 1929 - 1938 and there was no way to invest in the index at the time.
Yet another unsupported "fact." Who is "they" and where (link or literature citation, please) is this "claim?"

BTW, the return of the S&P or any other broad index is totally irrelevant to the argument for passive investing. The argument for passive investing is that mountains of data show it to consistently beat all but a tiny number of stock-pickers and that the stock pickers' results are not persistent. Whether the reference index is good, bad, or indifferent the vast majority of stock pickers' results are worse.

"THEY" Would be the Standard & Poors Corporation and they appear to be making this "claim". You know, they guys who came up with the idea.... I also agree you should never pick individual stocks.

https://www.spindices.com/our-company/our-history/
 
Does it matter? We can't get in a time machine and buy those stocks anyway. It seems any reasonable proxy for "the market" is what we are interested in from a historical research view.

Maybe later I'll dig a bit deeper to see how Schiller handled this, but I'm assuming he gave it some serious thought and had no motivation to bias it:

Online Data - Robert Shiller

-ERD50

Since the top 10 market cap stocks mirror the 500 and VTI most likely anyway, whatever was added after #10 was probably irrelevant.
 
"THEY" Would be the Standard & Poors Corporation and they appear to be making this "claim". You know, they guys who came up with the idea.... I also agree you should never pick individual stocks.

https://www.spindices.com/our-company/our-history/
Thanks for actually providing a link, irrelevant though it may be. I see no claims made there and I see nothing that bears on investment strategy, active or passive. How does this support your assertion?
 
"THEY" Would be the Standard & Poors Corporation and they appear to be making this "claim". You know, they guys who came up with the idea.... I also agree you should never pick individual stocks.

https://www.spindices.com/our-company/our-history/

Thanks for actually providing a link, irrelevant though it may be. I see no claims made there and I see nothing that bears on investment strategy, active or passive. How does this support your assertion?

Like OldShooter, I fail to see the relevance. From the link:

1896: Charles Dow develops what is now known as the Dow Jones Industrial Average®.
1923: Standard Statistics Company, predecessor to Standard & Poor’s, develops its first stock market indicators, covering 233 companies.

1926: Standard Statistics Company launches the 90-Stock Composite Price Index.

1941: Standard Statistics merges with Poor’s Publishing to form Standard & Poor's. The company stock market indicator developed in 1923 grows from 233 to 416 companies.

What does the S&P not being the S&P 500 in the distant past have to do with any comparison of active/passive investing today?

Maybe the question needs to be re-stated, before we go further off-track:

Is there a 'system' of stock or sector picking that a personal investor can use, that is rule based, that has a history of outperforming a B&H the Total Market strategy?
I'd want to see data for about the past 30 years to cover a few market cycles. But 5-10 years data would be worth looking at, if that's all you have.

I really don't know where you are coming from Running_Man. You seem to be certain that this should be accepted as fact, yet, instead of any usable data, you bring up other stuff that doesn't seem to answer the question.

Where's the data?

-ERD50
 
Last edited:
Thanks for actually providing a link, irrelevant though it may be. I see no claims made there and I see nothing that bears on investment strategy, active or passive. How does this support your assertion?

It shows that in 1926 there was 90 stocks in the index and in 1957 the index was published for the first time with 500 stocks in 1957.

Stocks added to the S&P 500 are subject to the review of the S&P committee, until 1977 no financial stocks were allowed in the index. Of course in 1929 the law was that if you owned a bank your risk in bankruptcy of the firm was 2X your investment.... that's right invest a thousand it goes bankrupt and you owe $1,000. But the S&P 500 did not include financial stocks until 1977. By the way bank stock investing was extremely popular in the 1920's and were considered the safest of investments,https://business.financialpost.com/opinion/when-bank-shareholders-were-liable-for-bank-losses
In 1988 the Committee voted to exclude foreign stocks that were included to that point

Jeremy Siegel cited paper that shows all the manipulation of the S&P500 has actually reduced performance of the index.
http://citeseerx.ist.psu.edu/viewdoc/download?doi=10.1.1.421.7832&rep=rep1&type=pdf
 
Last edited:
I was wondering if anybody can give me some feedback on the following strategy
Once a year (eg early January) buy top 10 of biggest companies (market cap). and swap/redistribute once a year when needed.
.....
My first thought is this sounds like a specialized form of momentum investing, especially if the purchases were weighted based on market cap. Otherwise might it be an example of "buy high" and "sell _?_". Personally, I don't like the strategy very much, since the indexes are already market cap weighted I would not want to boost my investments even more at the top end. Even though it might provide better than average returns due to the inherent advantages large companies have against their competitors.


One factor that I have only read peripherally about, is how might the move towards index investing boost strategies like this? As the more people shift towards buying the broader indexes, as Millineals replace the Boomers will their investing patterns cause the mega caps grow even faster??
 
It shows that in 1926 there was 90 stocks in the index and in 1957 the index was published for the first time with 500 stocks in 1957.

Stocks added to the S&P 500 are subject to the review of the S&P committee, until 1977 no financial stocks were allowed in the index. Of course in 1929 the law was that if you owned a bank your risk in bankruptcy of the firm was 2X your investment.... that's right invest a thousand it goes bankrupt and you owe $1,000. But the S&P 500 did not include financial stocks until 1977. By the way bank stock investing was extremely popular in the 1920's and were considered the safest of investments,https://business.financialpost.com/opinion/when-bank-shareholders-were-liable-for-bank-losses
In 1988 the Committee voted to exclude foreign stocks that were included to that point

Jeremy Siegel cited paper that shows all the manipulation of the S&P500 has actually reduced performance of the index.
http://citeseerx.ist.psu.edu/viewdoc/download?doi=10.1.1.421.7832&rep=rep1&type=pdf
And what exactly does this blather have to do with passive or active investing?
 
And what exactly does this blather have to do with passive or active investing?

You asked me what I meant about fake indexing in reference to the S&P500 index from 1926. You claimed I made up the fact there were only 90 stocks in 1926 and it didn't become a full index until 1957. And asked for more links, I didn't want to post it you asked for it. Really?
 
You asked me what I meant about fake indexing in reference to the S&P500 index from 1926. You claimed I made up the fact there were only 90 stocks in 1926 and it didn't become a full index until 1957. And asked for more links, I didn't want to post it you asked for it. Really?

But it has does not appear to have anything to do with passive/active investing in the past 30 years.

If you have a point to make about passive/active investing in the past 30 years, please make it. You accused us of being closed minded, but we ask questions to learn more about this system, and you just divert the topic to some historical trivia about the S&P index in 1926, or 1957, or 1977, etc.

My Grampa told me he got a nice lunch and a beer for a nickel back in those days. Interesting, but it doesn't help me make a lunch decision today.

So what about this system for someone investing in 2019?

-ERD50
 
For those interested here is the excel i put together.
its quite messy (sorry), i just wanted to see as quick as possible if this was investing more time...

https://ufile.io/knsagphi

since XOM AAPL MSFT GOOG where present in all years i first looked at those (buy first trading day of 2009, don't rebalance and see what happens, that was the chart)

On the last tab page, i did use all top 10 (10% each) and i did rebalance total profit/loss each year. first trading day of the year. there is a chart but it has only 1 datapoint per year.

my motivation was to find something simple (only look 1x year) and use companies that don't go broke quickly.

Best regards...
 
here the chart & compared to spy.
top 10 market cap, 10% each, rebalance 1x year on first trading day.
a lot the same...
chart5.png
 
here the chart & compared to spy.
top 10 market cap, 10% each, rebalance 1x year on first trading day.
a lot the same...
I did glance at your spreadsheet and I did not see any references to dividends. To be useful, this type of comparison must be done on a total return basis. Dividends paid by the stocks and by SPy are part of total return; it's not just the year-beginning and year-ending sticker prices.
 
But it has does not appear to have anything to do with passive/active investing in the past 30 years.

If you have a point to make about passive/active investing in the past 30 years, please make it. You accused us of being closed minded, but we ask questions to learn more about this system, and you just divert the topic to some historical trivia about the S&P index in 1926, or 1957, or 1977, etc.

My Grampa told me he got a nice lunch and a beer for a nickel back in those days. Interesting, but it doesn't help me make a lunch decision today.

So what about this system for someone investing in 2019?

-ERD50


Well if you don't want your Grampa - I had a Grandpa and a Grandma is a Grampa a passive version of Grandparents? Or is it just an index of Grandparents, anyway - to go on about how far a nickel went in the day, don't ask him how does he know what the value of a nickel was back then. The question specifically was asked of me about what I meant about fake index in 1926 and that I made up without any quoting the fact the stocks in the S&P500 were selected after the great depression.
 
... The question specifically was asked of me about what I meant about fake index in 1926 and that I made up without any quoting the fact the stocks in the S&P500 were selected after the great depression.

Well the question was posed because you brought it up. Then you were asked about it, I think in an attempt to understand if it had any relevance.

So, once again...

" So what about this system for someone investing in 2019?"

Data, rules,etc?


-ERD50
 
Well the question was posed because you brought it up. Then you were asked about it, I think in an attempt to understand if it had any relevance.

So, once again...

" So what about this system for someone investing in 2019?"

Data, rules,etc?


-ERD50

OK back to the original,
Since the most capitalized stocks can be tracked and were actually being purchased by investors all the way back to 1926, unlike S&P500 index investors, who could not and did not invest back to 1926, a review can be done of the actual performance of the 10 largest CAP stocks by margin. Personally I plan on excluding any of the top 10 who have a Value Line Safety rating of 3 or lower and a timeliness of 4 or lower at the start of the year. I will also exclude any that do not pay a dividend.

I am going to review the raw data of the 10 largest CAP stocks as is, layer my exclusions on top and see what the results are.
 
Well the question was posed because you brought it up. Then you were asked about it, I think in an attempt to understand if it had any relevance.

So, once again...

" So what about this system for someone investing in 2019?"

Data, rules,etc?


-ERD50

OK back to the original,
Since the most capitalized stocks can be tracked and were actually being purchased by investors all the way back to 1926, unlike S&P500 index investors, who could not and did not invest back to 1926, a review can be done of the actual performance of the 10 largest CAP stocks. Personally I plan on excluding any of the top 10 who have a Value Line Safety rating of 3 or lower and a timeliness of 4 or lower at the start of the year. I will also exclude any that do not pay a dividend. Rebalancing will be performed once per year on the last day of the year.

I am going to review the raw data of the 10 largest CAP stocks as is, layer my exclusions on top and see what the results are.
 
For the OP: There are roughly 10,000 mutual funds chasing roughly 3,600 stocks in the US market. So if you assume that each mutual fund has several analysts each looking at several stocks, then you have maybe ten analysts looking at every single stock. Charles Ellis, in "Winning The Loser's Game" theorizes that the reason stock behavior is random is that all these analysts and all their computer power just cancels out.

The flip side of that coin is that if there actually were such a simple scheme that showed backtesting success, serious money would have noticed this and tried to take advantage of it. But if the crowd tries to work a scheme, it destroys the success of the scheme. The crowd activity raises the buy side costs and depresses the sell side proceeds, eventually negating whatever opportunity might have been signaled by the back testing. So we are back to the random walk.
 
OK back to the original ...
I am going to review the raw data of the 10 largest CAP stocks as is, layer my exclusions on top and see what the results are.
Good to hear. Before you invest too much time in this, I think it would be helpful to outline exactly what data, time frames, and how you plan to put it together.

If the 'skeptics' here could review that first, you might get some input that would be helpful. I suspect there's a communication gap here between what we would want to see and what you think we want to see. Maybe not, but we'd need that info anyhow to understand whatever you put together, so why not take a 1st step of sharing the plan beforhand? Might save us all some time/effort.

-ERD50
 
I will think about starting a thread on it in the near future, I have already called Value Line about getting past Value Line reports, have to negotiate a bit on the price of that yet.
 
I will think about starting a thread on it in the near future, I have already called Value Line about getting past Value Line reports, have to negotiate a bit on the price of that yet.

I'll look forward to that. But did you see my earlier post? It would still make sense to review your plan before putting any effort into it.

-ERD50

Good to hear. Before you invest too much time in this, I think it would be helpful to outline exactly what data, time frames, and how you plan to put it together.

If the 'skeptics' here could review that first, you might get some input that would be helpful. I suspect there's a communication gap here between what we would want to see and what you think we want to see. Maybe not, but we'd need that info anyhow to understand whatever you put together, so why not take a 1st step of sharing the plan beforehand? Might save us all some time/effort.

-ERD50
 
Back
Top Bottom