A number of recent articles have suggested that those who have been able to retire early have just been lucky. Really? Maybe there are some who have FIRE'ed because of a windfall like a stock buyout or an inheritance. However, I suspect that the majority have just tried to follow the basic practices that we talk about over and over on this forum, i.e. LBYM, DCA, low cost index funds, asset allocation, re-balancing, etc.
So, how were the last few decades of investing compared to past history? Could FI reached by being by being "good" or did you need to be lucky? It sure didn't feel like such a lucky time: Black Monday, the 90's Recession, the Dot Com bubble, the Great Recession, 9/11, invasions of Kuwait, Afghanistan, Iraq, to name a few.
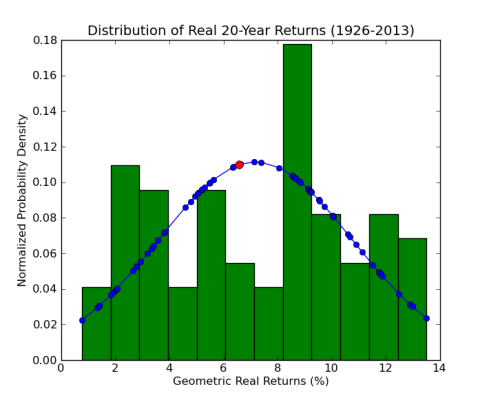
I've plotted the real returns of someone who was in the stock market for the last 20-years (the 25 and 30-year plots are similar). The red dot is the CAGR for the last 20 year period ending in 2013. You can see that the last few decades have been pretty typical for investing - about 55% of the time the stock market performed better. There is an old saying that goes, "It is better to be lucky than good" Maybe. But good is good enough when it comes to FIRE.
Zorba
(Details: S&P returns with dividends and inflation numbers from Bogleheads forum. The blue dots are the actual returns before binning. Look how badly the real distribution deviates from a Normal distribution (blue line)! A more balanced portfolio would be better but I used the data with the longest time series and doubled checked the basic result using broader market data starting in 1974.)
So, how were the last few decades of investing compared to past history? Could FI reached by being by being "good" or did you need to be lucky? It sure didn't feel like such a lucky time: Black Monday, the 90's Recession, the Dot Com bubble, the Great Recession, 9/11, invasions of Kuwait, Afghanistan, Iraq, to name a few.
I've plotted the real returns of someone who was in the stock market for the last 20-years (the 25 and 30-year plots are similar). The red dot is the CAGR for the last 20 year period ending in 2013. You can see that the last few decades have been pretty typical for investing - about 55% of the time the stock market performed better. There is an old saying that goes, "It is better to be lucky than good" Maybe. But good is good enough when it comes to FIRE.
Zorba
(Details: S&P returns with dividends and inflation numbers from Bogleheads forum. The blue dots are the actual returns before binning. Look how badly the real distribution deviates from a Normal distribution (blue line)! A more balanced portfolio would be better but I used the data with the longest time series and doubled checked the basic result using broader market data starting in 1974.)
")