Lsbcal
Give me a museum and I'll fill it. (Picasso) Give me a forum ...
I remember the October 1987 crash well. DW had come down with pneumonia and we had a 3 year old boy. It was nerve wracking.
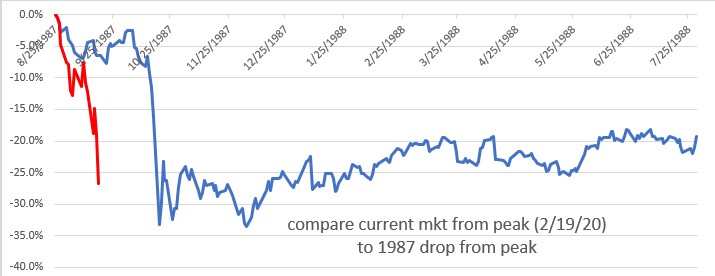
I created this chart to show me how the current crash compares to then. The current crash was on us much more rapidly probably because the cause is very different.
This chart starts from the peak of the SP500 in August 1987. The red line is the current market as of 3/12/2020 and the time line just shows the 1987 period. The chart extends out to about 1 year from the peak.
I might update this over time and display if there is interest.
 ."
."